 Elasticsearch Series
- ELK
- Kibana: DevTools
- This Post
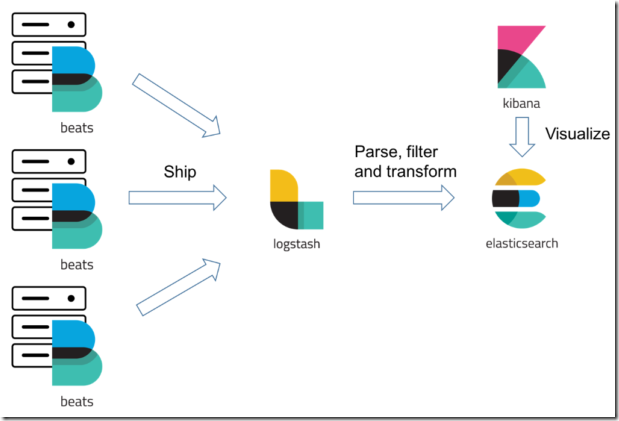
Beats is Elastic� platform for data shippers. From previous posts we know that Elasticsearch and Logstash are servers and we can send data (usually time series data) to them. If data needs some input/filter/output parsing Logstash is there or else we can submit data directly to Elasticsearch. Beats are single-purpose data shippers that we can deploy on systems / machines / containers acting as clients for either Logstash or Elasticsearch � and then centralize data either directly to Elasticsearch or through Logstash. There are different beats available like Filebeat that can harvest files and is mostly used to feed log files into Elasticsearch, Winlogbeat that can read from Windows� event log channels and ship the event data into the Elasticsearch� structured indexes, Metricbeat that can collect CPU, memory and other system metrics and can log statistics into Elasticsearch and Packetbeat can monitor network services using different network protocols and can record application latency, response times, SLA performances and user access patterns etc
Beats are "lightweight" and easy to deploy; they are developed using Go; so there is just a binary along with its configuration file to deploy and have no external dependencies; ideal for container deployment and use limited system resources.
- Take a look at https://www.elastic.co/products/beats for complete first party Beats list
Modules and libbeat
Many beats come with modules / plugins to help it collect and parse/filter data; for instance Filebeat comes with Apache, IIS, Nginx, MySQL, PostgreSQL, Redis, Netflow, Cisco and many others; using these it can harvest relevant log files; for example using IIS module we can feed IIS log files into Logstash or Elasticsearch. Winlogbeat comes with Sysmon Module. Sysinternals� System Monitor utility service that log system activity events into its own event log channel that Winlogbeat can then process.
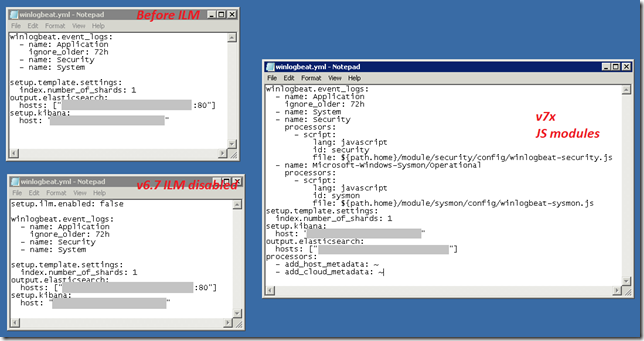
Beats are open source and code is available on Github; all the Beats uses libbeat; a Go framework from Elastic to create Beats. All the official Beats uses it that makes all of them to feel and work in consistent and uniform way; for instance for configuration they all use YML files and now with v7.2 releases that can run Javascript code to process events and transform data �at the edge� (industrial buzz). The beats modules also uses this same Javascript option for instance Winlogbeat�s Sysmon module is configured like this:

There are many open source beats from community using this same libbeat; for example MQTTBeat (https://github.com/nathan-K-/mqttbeat) can be quite useful in IoT implementation. It can read MQTT topics and can save messages into Elasticsearch (or process them through Logstash). HttpBeat (https://github.com/christiangalsterer/httpbeat) call http endpoints (POST/GET requests at URLs etc) at specified intervals and can record JSON outputs and HTTP server metrics. HttpBeat is now a Http module of Metricbeat
- Take a look at https://www.elastic.co/guide/en/beats/libbeat/master/index.html for libbeat reference, https://www.elastic.co/guide/en/beats/libbeat/master/community-beats.html for the community beats and https://github.com/elastic/beats for libbeat Go framework code/library
Index Lifecycle Management
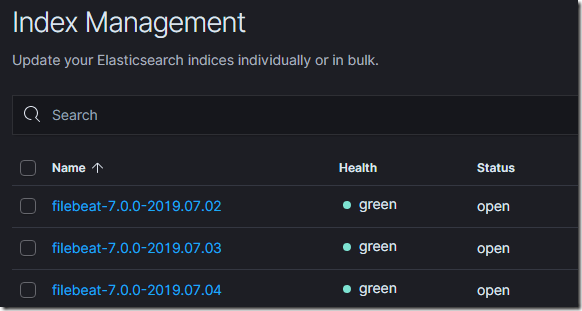
By default the Beats creates indexes for each day, the beat name followed by its version and then the date; for instance Filebeat will create following indexes:
Version 6.6.0 the Elastic stack introduced Index Lifecycle Management; ILM; using this feature in Elasticsearch we can manage indices as they age. For example, instead of creating daily indices where index size can vary based on the number of Beats and number of events sent, use an index lifecycle policy to automate a rollover to a new index when the existing index reaches a specified size or age. From v7 releases, Beats now uses ILM by default when it connects to Elasticsearch that supports life cycle management, Beats create their default policy automatically in the Elasticsearch and applies it to any indices created by them. We can then view and edit the policy in the Index lifecycle policies User interface in Kibana.
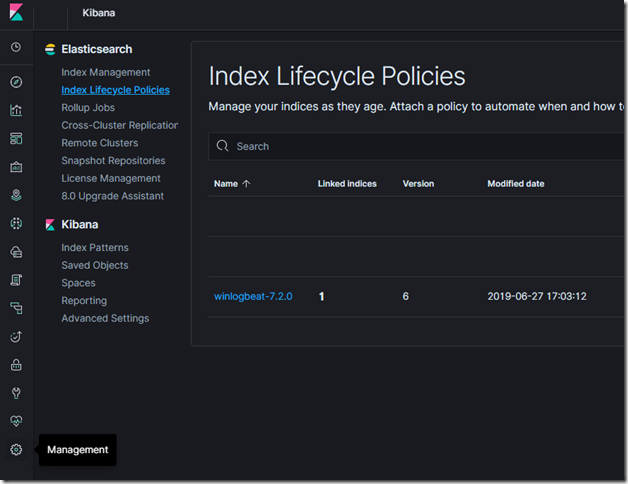
We can change this behaviour by changing elasticsearch to true or false in Beat�s configuration�s output section
- Take a look at https://www.elastic.co/guide/en/elasticsearch/reference/current/index-lifecycle-management.html for more information
Elastic Common Schema
Beats gather the logs and metrics from your unique environments and document them with essential metadata from hosts. Here is an example of Filebeat entry.
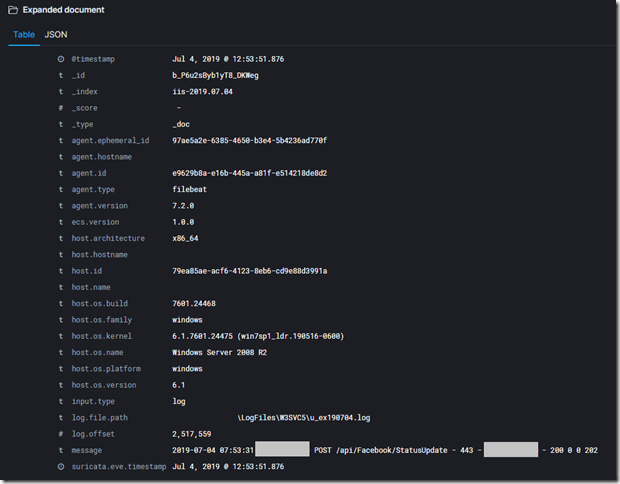
Elastic Common Schema (ECS) is a specification that provides a consistent and customizable way to structure the data in Elasticsearch, facilitating the analysis of data from diverse sources. With ECS, analytics content such as dashboards and machine learning jobs can be applied more broadly, searches can be crafted more narrowly, and field names are easier to remember. Imagine searching for a specific user within data originating from multiple sources. Just to search for this one field, you would likely need to account for multiple field names, such as user, username, nginx.access.user_name, and login. Implementing ECS unifies all modes of analysis available in the Elastic Stack, including search, drill-down and pivoting, data visualization, machine learning-based anomaly detection, and alerting. When fully adopted, users can search with the power of both unstructured and structured query parameters. It is an open source specification available at https://github.com/elastic/ecs that defines a common set of document fields for data ingested into Elasticsearch.
- Take a look at https://www.elastic.co/guide/en/ecs/current/index.html and read https://www.elastic.co/blog/introducing-the-elastic-common-schema for more information.
Starting with version 7.0, all Beats and Beats modules generate ECS format events by default. This means adopting ECS is as easy as upgrading to Beats 7.0. All Beats module dashboards are already modified to make use of ECS.
- For more information about v7 Beats release read https://www.elastic.co/blog/beats-7-0-0-released
Dashboards
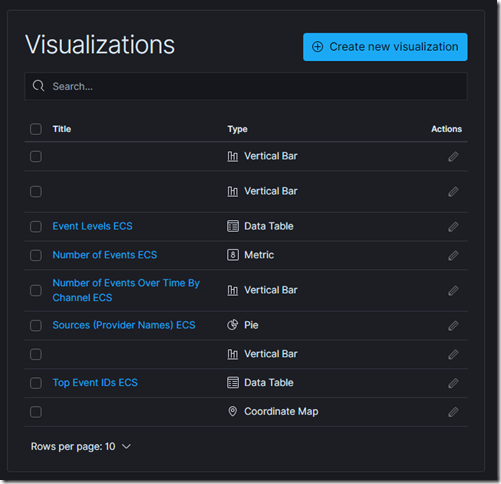
If we run the beat with �help; we will often see �setup� option that creates the index template (that we see in the previous post are used to define fields and configure how the new indexes will be created), Machine Learning Job (if you have X-Pack the commercial addon from Elastic) and Dashboards. Beats can access Kibana if you have specified its location in their configuration file and create Kibana Index Patterns, Visualization and Dashboards
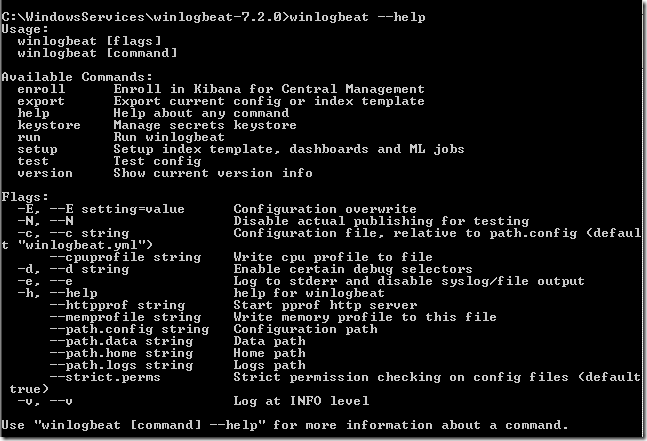
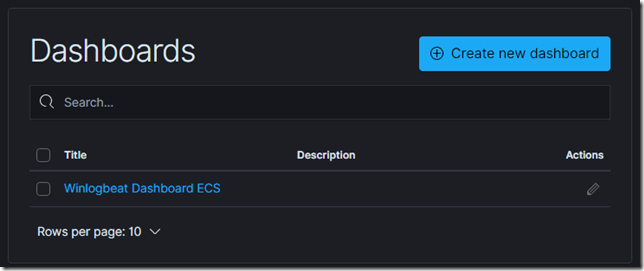
For example running winlogbeat setup will create the Index Patterns, Visualizations and Dashboard (if we have Kibana URL in its configuration YML file)
We can view the Visualizations and Dashboards in Kibana (and learn how they have made it and use this learning to create Visualizations and Dashboards for our other data that we are pushing into Elasticsearch)
- Note that I am using v7x Winlogbeat and its using ECS and has created Visualization and Dashboards with ECS in name to avoid clash from v6x and earlier Winlogbeat that you might have
Debugging and Service Installation
Using beat test we can test the configuration; for example winlogbeat test config we can test the configuration file and using winlogbeat test output we can ensure Elasticsearch is accessible.
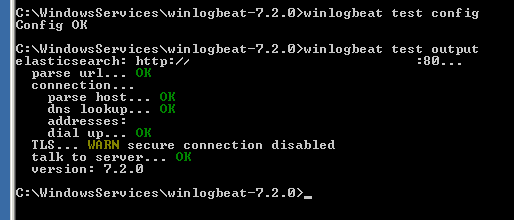
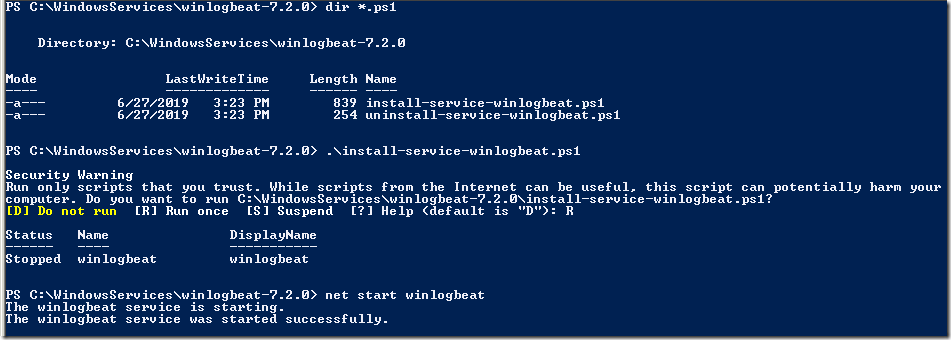
We can run the Beats interactively using its binary; it will report any error on the console and we can fix it accordingly. Once everything is in order; we can install the Beat (Winlogbeat, Filebeat or other); the Beats usually comes with instruction or scripts to do this; for instance Winlogbeat comes with Powershell script to install / uninstall it as Windows Service.
Kibana and X-Pack
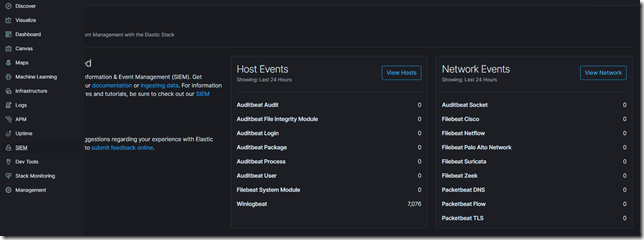
Recent versions of Kibana now has dedicated appplications for some Beats, for instance there is Uptime application that works with Hearbeat, Logs that work with Filebeat and SIEM (Security Information & Event Management)
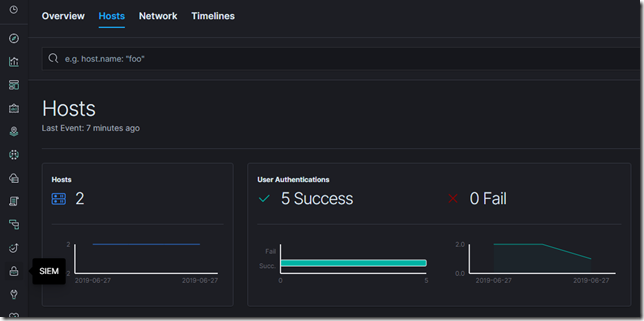
Elastic SIEM is being introduced as a beta in the 7.2 release of the Elastic Stack. SIEM Kibana application is an interactive workspace for security teams to triage events and perform initial investigations. It enables analysis of host-related and network-related security events as part of alert investigations. With its Timeline Event Viewer the analysts can gather and store evidence of an attack, pin and annotate relevant events, and comment on and share their findings. It uses the data that follows the ECS format being pushed by Auditbeat, Filebeat, Winlogbeat and Packetbeat (in its first release)
- Read https://www.elastic.co/blog/introducing-elastic-siem for more information on Elastic SIEM
Elastic used to offer Sheild, Watcher and Marvel commercial plugins that adds features like Security and Alerting to ELK setup. They then merged these products into X-Pack which is an Elastic Stack extension that bundles security, alerting, monitoring, reporting, and graph capabilities into one easy-to-install package. While the X-Pack components are designed to work together seamlessly, you can easily enable or disable the features you want to use. Note that this is a commercial product and they in early 2018 they announced opening the code of X-Pack features - security, monitoring, alerting, graph, reporting, dedicated APM UIs, Canvas, Elasticsearch SQL, Search Profiler, Grok Debugger, Elastic Maps Service zoom levels, and machine learning. Many of these new additions in Kibana are result of this and at the same time they are also adding new Kibana applications like SIEM. So its best to keep updating your ELK setup to avail all these new features.
