TICK Series
| Time Series Databases
|
 InfluxDB is another open source time series database and is written in Go language. It has no external dependency and its data model consists of several key-value pairs called the fieldset. Each point has a timestamp a value and fieldset. Timestamp and fieldset form a tagset and each point gets indexed by its timestamp and fieldset. Collection of tagsets form a series and multiple series can be grouped together by a string identifier to form a measurement. The measurement has a retention policy that defines how data gets downsampled and deleted. InfluxDB has SQL-like query engine having builtin time-centric functions for querying data. �Continuous Queries� can run periodically (and automatically by the database engine) storing results in a target measurement. It can listen on HTTP, TCP, and UDP where it accepts a data using its line protocol that is very similar to Graphite.
The InfluxDB also has a commercial option; which is a distributed storage cluster giving horizontal scalability with storage and queries being handled by many nodes at once. The data gets sharded into the cluster nodes and it gets consistent eventually. We can query the cluster that runs sort of like MapReduce job.
InfluxDB vs Prometheus
InfluxDB has nanosecond resolution while Prometheus has millisecond, InfluxDB supports int64, float64, bool, and string data types using different compression schemes for each one while Prometheus only supports float64. Prometheus approach of High Availability is to run multiple Prometheus nodes in parallel with no eventual consistency; and its Alertmanager than handles the deduplication and grouping. InfluxDB writes are durable while Prometheus buffers the writes in the memory and flushes them periodically (by default each 5min). InfluxDB has Continuous Queries and Prometheus has Recording Rules. Both does data compression and offer extensive integrations; including with each other. Both offers hooks and APIs to extend them further.
Prometheus is simple, more performant and suits more for metrics. Its simpler storage model, simpler query language, alerting and notification functionality suits more to system administrators. That said; Prometheus being a PULL model; the server needs access to the nodes to retrieve the metrices and it might not suite in scenarios like IoT where devices are behind Wifi Gateway; or polling metrices from office machines that are behind NAT. Prometheus doesn't allow recording past data; in case you are extracting some time series data from some hardware logger; but InfluxDB let you record such data. In such situations where Prometheus is not full filling your requirements or where you need RDBMS like functionality against the time series data; we can use InfluxDB
IoT Example
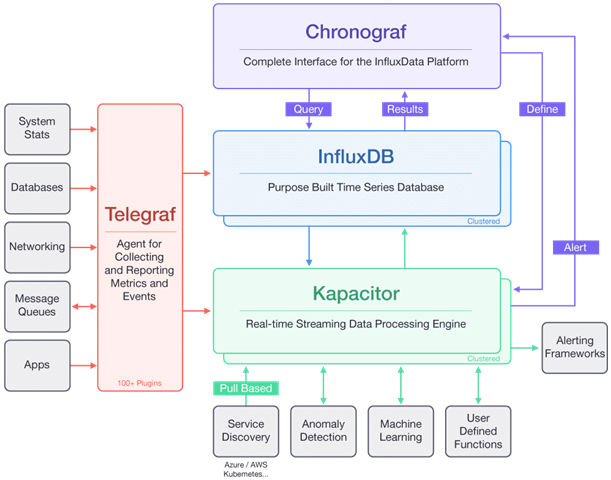
For this post I am using Internet of Thing (IoT) scenario. Lets revisit an olt IoT post in which we used ESP8266 to measure room temperature using the sensor and send the readings to �ThingSpeak� service to view the temperature readings over time in the chart. In this post; we will try to remove ThingSpeak dependency using the �TICK stack�, the InfluxDB is an integral component of. TICK is an open source Time Series Platform for handling metrics and events and it consists of Telegraf, InfluxDB, Chronograf, and Kapacitor open source projects all written in Go language. Chronograph is an administrative user interface and visualization engine. We need it to run InfluxQL; the SQL like queries against the data in InfluxDB. It also offers templates and libraries to build dashboards with real-time visualizations of time series data like Grafana
- TICK picture taken from https://www.influxdata.com/time-series-platform
Some might argue that we can use Prometheus with Pushgateway; the IoT devices can push their metrices to the Pushgateway that get hosted at the known location; its a valid argument and yes we can use it instead; as it acts as a buffer and Prometheus polls the metrices off the gateway periodically; the data sampling will not get reflected in the Time series database. Prometheus client libraries when used with Pushgateway usually sends all the metrices; even if one value is changed and needs the push; this increases network traffic and load on the sender; not something good for IoT scenario. Lastly Pushgateway remembers all the metrices even if they are no longer being pushed from the client; so for instance an IoT device is sending its IP address or host name in the metric; it will get remembered and next time if it gets different IP (usually the case in Wifi/behind NAT) it will get remembered as separate metric in Pushgateway and given Prometheus is polling off Pushgateway it will keep recording no longer required metrices as well. The Pushgateway has an option to group the metrices and we can delete the whole group using Pushgateway HTTP/Web API; but its not very ideal
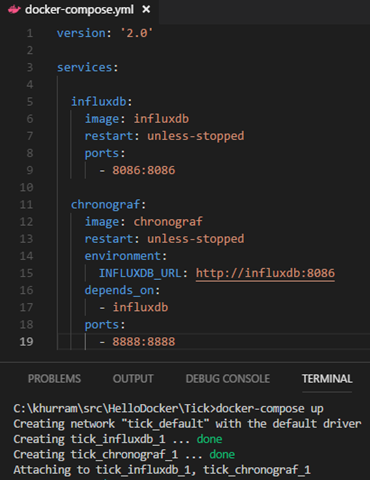
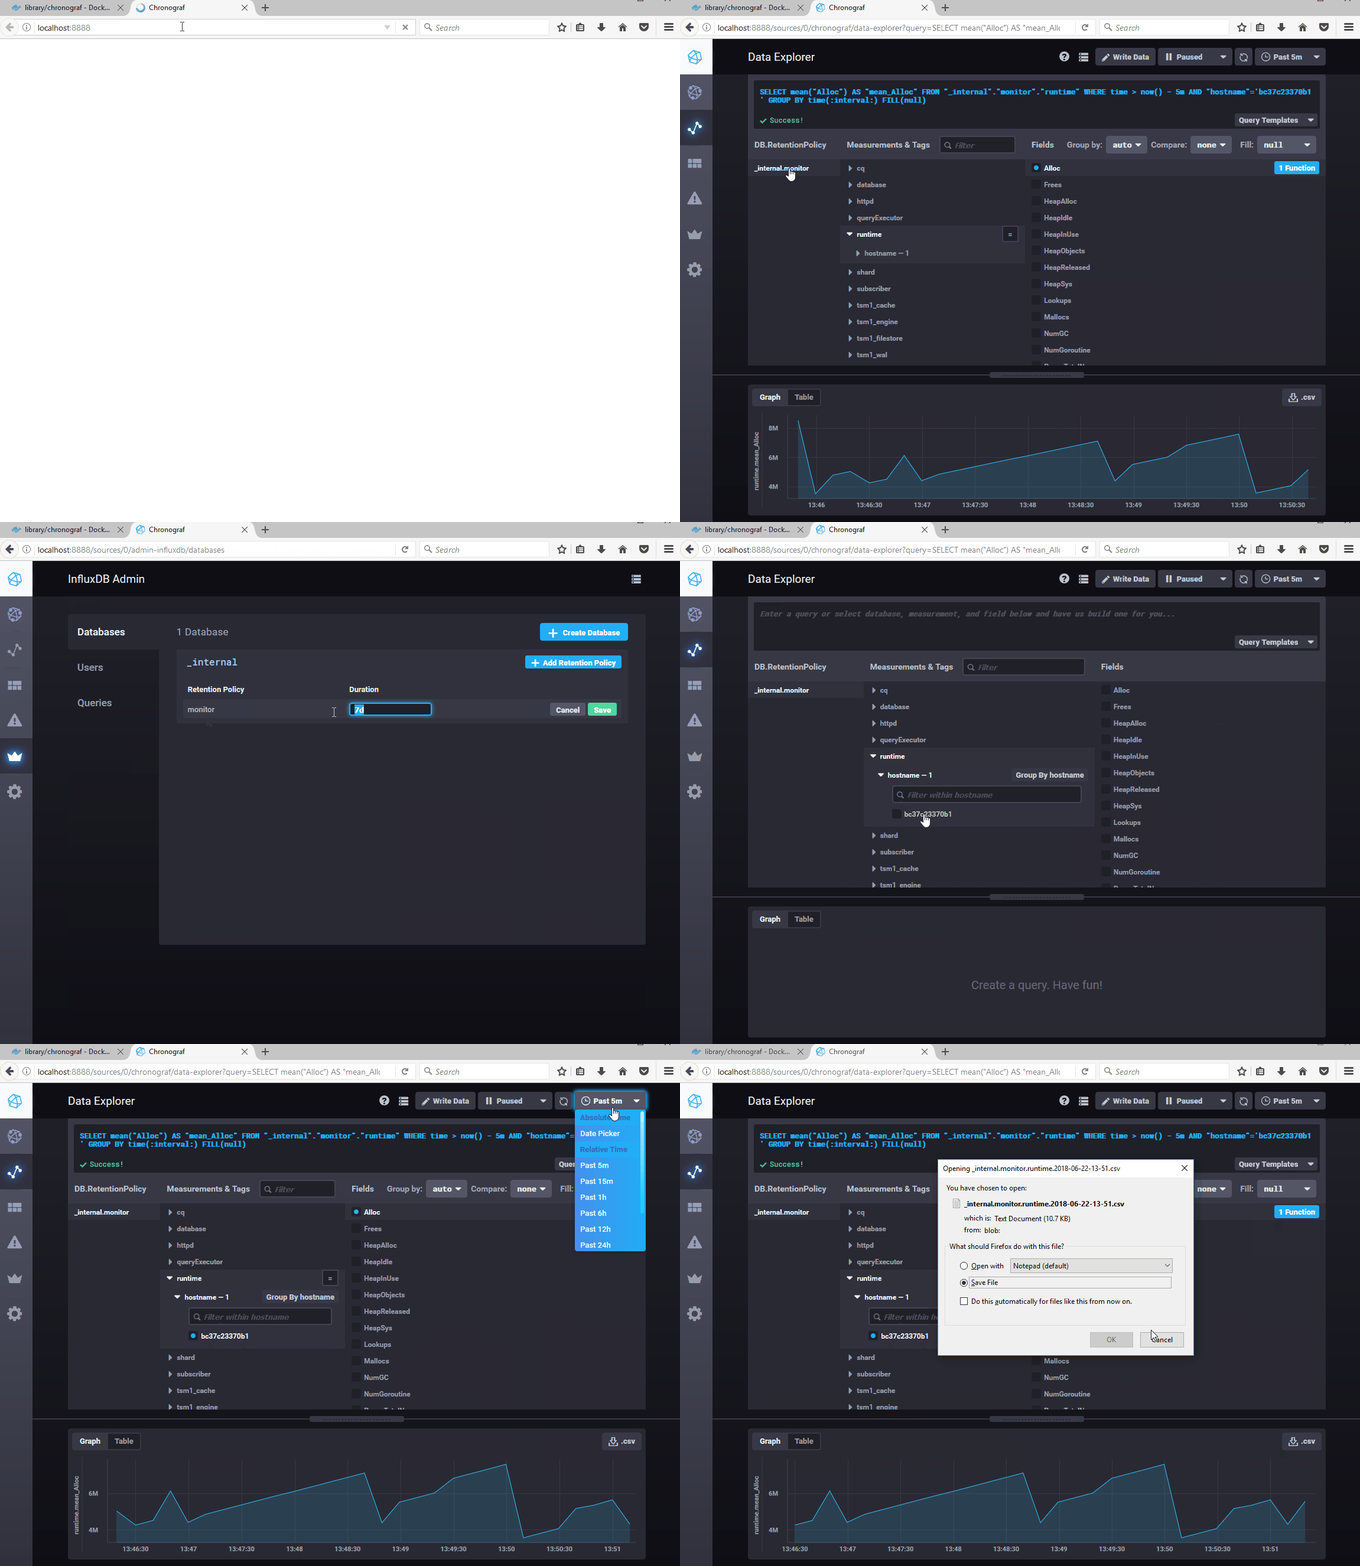
The most convenient way to spin up the TICK stack is by using Docker. Lets create a simple docker-compose.yml file having InfluxDB and Chronograf and spin it up. We can then access Chronograf and can explore InfluxDB where it has created _internal database logging its own metrics
- All required files are available in Tick folder @ https://github.com/khurram-aziz/HelloDocker
Lets extract the default �configuration� file of InfluxDB from its docker image first to build upon our configuration
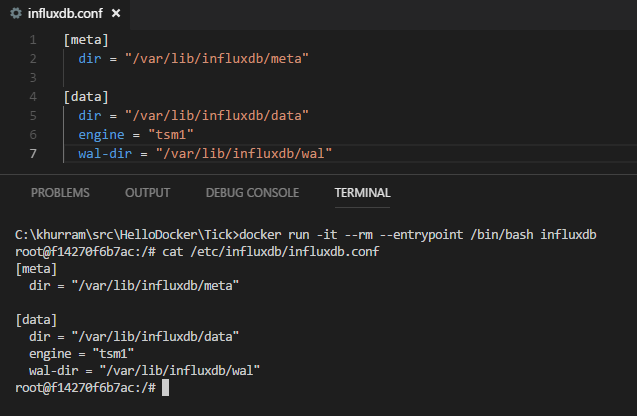
Next enable InfluxDB UDP interface by adding udp section in the influxdb.conf; also map this UDP port to Docker Host and allow incoming UDP traffic to the mapped port in host�s firewall so that our IoT device can send its metrics on the known IP/Port of our Docker host
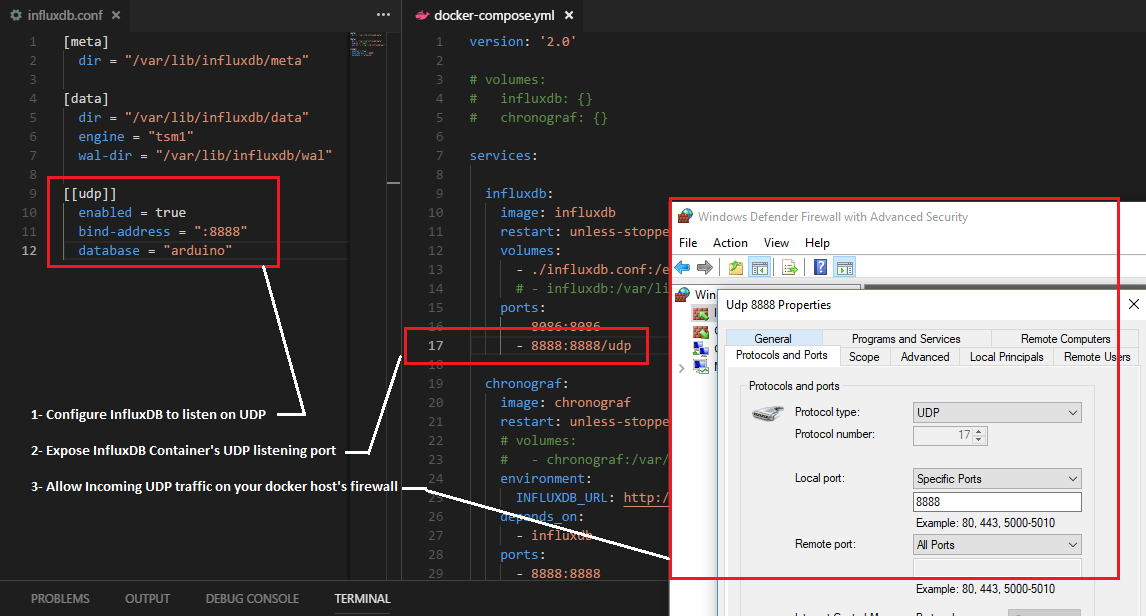
Now for the IoT firmware in Arduino; we just need to use the WiFiUDP instance from WiFiUDP.h and send the metric data using the InfluxDB line protocol; if we want to name our measurement temperature, and want to send device name, its local ip and raw sensor value along with the calculated temperature; we need to send following string in the udp packet
temperature,device=DEVICENAME,localIP=ITS-IP,sensorValue=S value=T
where S is sensor value and T is calculated temperature; our loop() function in Arduino will look something like this:
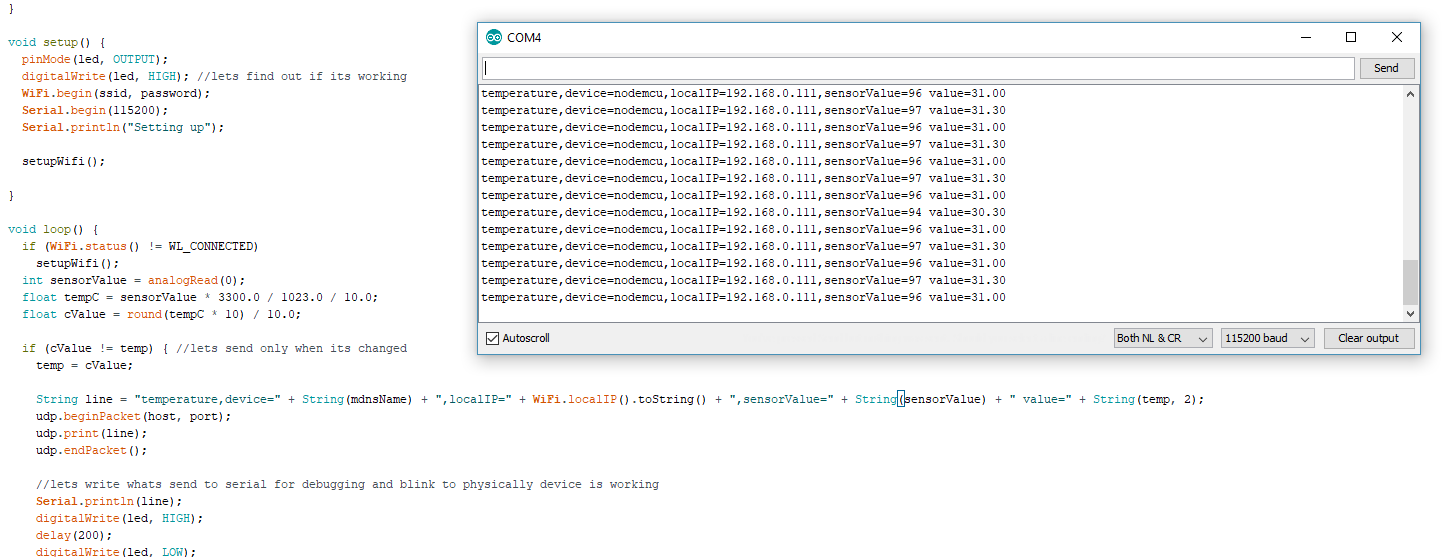
- For more details see https://www.influxdata.com/blog/how-to-send-sensor-data-to-influxdb-from-an-arduino-uno/
Bringing InfluxDB and Chronograf online; the data from IoT device will start logging and we can view the temperature graph in the Chronograf and export the raw data as CSV easily
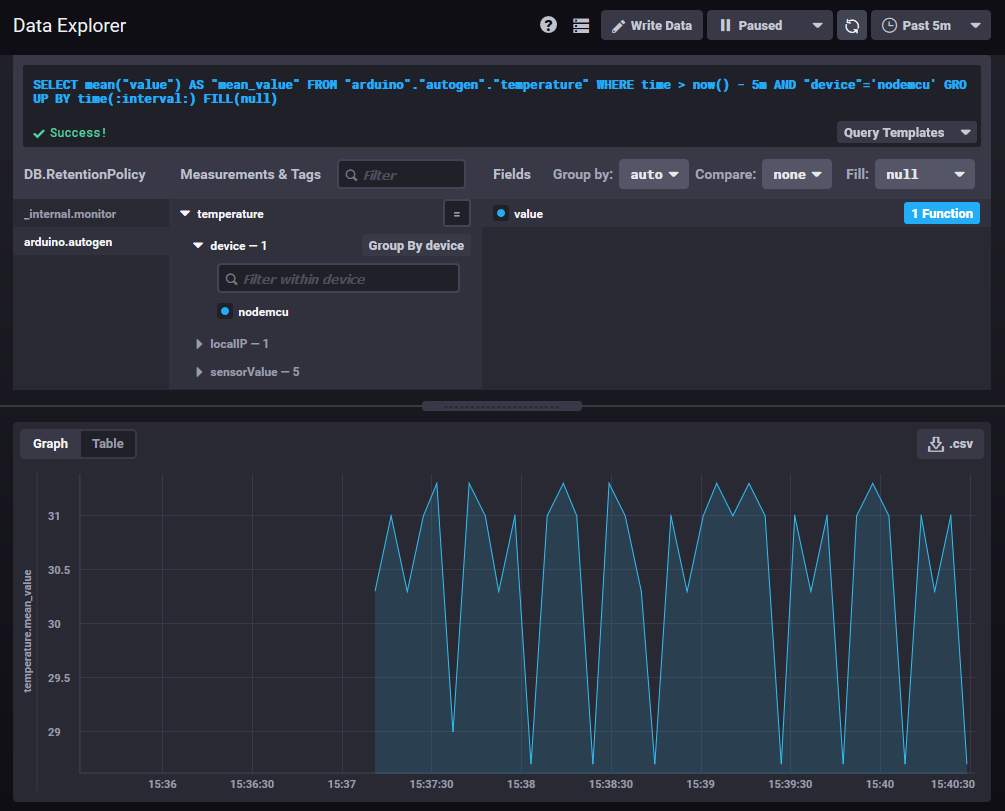
- The Arduino code; docker compose and container configuration files are available in Tick folder @ https://github.com/khurram-aziz/HelloDocker
In real world; Raspberry/Orange PIs can be used in remote cabinets with off the shelf / industrial strength temperature/humaditiy sensors. The boards can be connected to the switches directly due to their ethernet ports. These devices run full fledge Linux; you can access them remotely; run administrative scripts / commands; these boards also have USB ports where you can connect deployed devices administrative / serial ports. No need to send someone with laptops and physically connect in emergencies
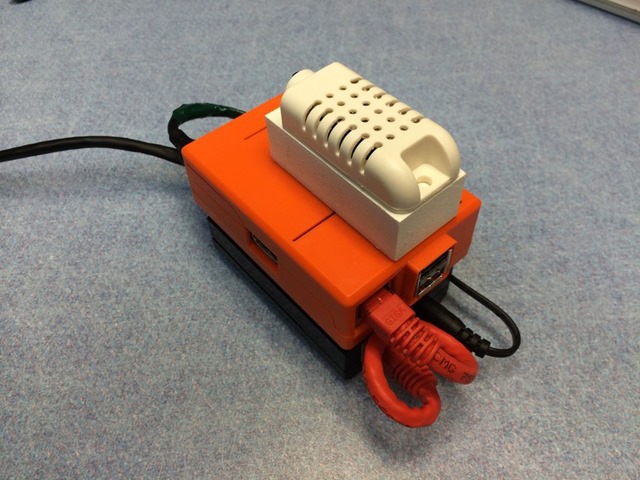
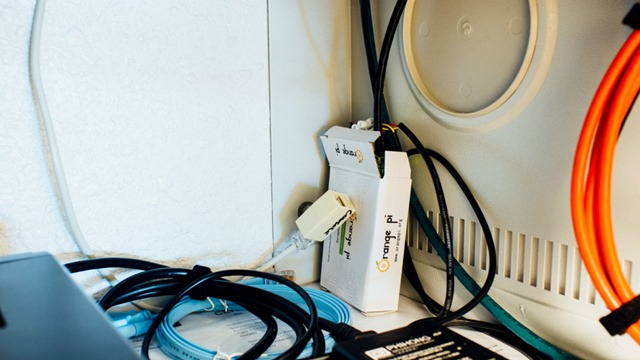
- Pictures taken from internet as reference
