| Prometheus Series
| Time Series Databases |
A time series is a series of data points indexed (or listed or graphed) in time order. Most commonly, a time series is a sequence taken at successive equally spaced points in time. Thus it is a sequence of discrete-time data. Examples of time series are heights of ocean tides, counts of sunspots, and the daily closing value of the Dow Jones Industrial Average. A time series database (TSDB) is a software system that is optimized for handling time series data, arrays of numbers indexed by time (a datetime or a datetime range). In some fields these time series are called profiles, curves, or traces. A time series of stock prices might be called a price curve. A time series of energy consumption might be called a load profile. A log of temperature values over time might be called a temperature trace. � Wikipedia
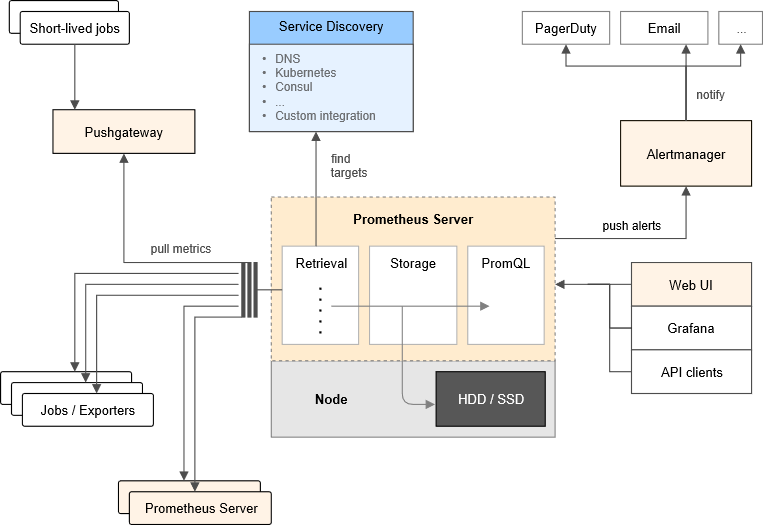
Prometheus is an open-source systems monitoring and alerting toolkit; most of it components are written in Go, making them easy to build and deploy as static binaries. Prometheus joined the Cloud Native Computing Foundation in 2016 as the second hosted project, after Kubernetes. It provides multi-dimensional data model with time series data identified by metric name and key/value pairs. It collects time series using HTTP pulls, HTTP targets can be discovered via service discovery or configuration files. It also features a query language and it comes with the web interface where you can explore the data using its query language and execute and plot it for casual / exploration purposes.
Picture Credit: https://prometheus.io/docs/introduction/overview
There are client libraries that we can use to add instrumenting support and integration with Prometheus Server. https://prometheus.io/docs/instrumenting/clientlibs has the list of these libraries for different languages and platform. There is also a push gateway for scenarios where adding HTTP endpoint to the application/device/node is not possible. There are standalone �exporters� that can retrieve metrics from popular services like HAProxy, StatsD, Graphite etc; these exporters have HTTP endpoint where they make this retrieved data available from where Prometheus Server can poll. Prometheus Server also exposes its own metrics and monitor its own metrics. It stores the retrieved metrics into local files in a custom format but also optionally can integrate with remote storage systems.
Node exporter is a Prometheus exporter for hardware and OS metrics exposed by *nix kernels, its written in Go; WMI exporter is the recommended exporter for Windows based machines that uses WMI for retrieving metrics. There are many exporters available. https://prometheus.io/docs/instrumenting/exporters has the list
Alertmanager is a seperate component that exposes its API over HTTP; Prometheus Server sends alerts to it. This component supports different alerting channels like Email, Slack etc and takes care of alerting concerns like grouping, silencing, dispatching and retrying etc.
Grafana is usually used on top of Prometheus; an open source tool that provides beautiful monitoring and metric analytics and dashboard features. Grafana has notion of data sources from where it collects data; and Prometheus is supported out of box.
For this post; lets consider we have a .NET 4 app; running on an old Windows 2003 box; may be because its integrated with some hardware whose drivers are not available for latest version of Windows restricting ourselves to continue to use this legacy .NET framework version. We want to modernize our app by adding monitoring support and may be some sort of Web API so we can make new components elsewhere and integrate to it. In .NET 4 applications if we want to have a HTTP endpoint; we can either use WebServiceHost class from System.ServiceModel.Web library intended for WCF endpoints (but we can do text/html with it) or there exists an older version of Microsoft.AspNet.WebApi.SelfHost package on Nuget. For our scenario this nuget package suits more as it will enable us to expose Web Api in our application as well.
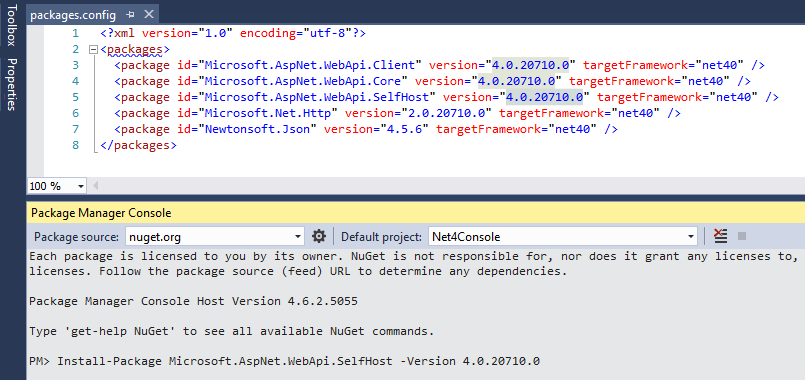
In our application Main/Startup code; we need to configure and run the HttpSelfHostServer; to have /status and /metrics pages along with /api http endpoint our configuration will look something like what�s shown in the picture; and then we can simply add a StatusController inheriting from the ApiController and write the required action methods
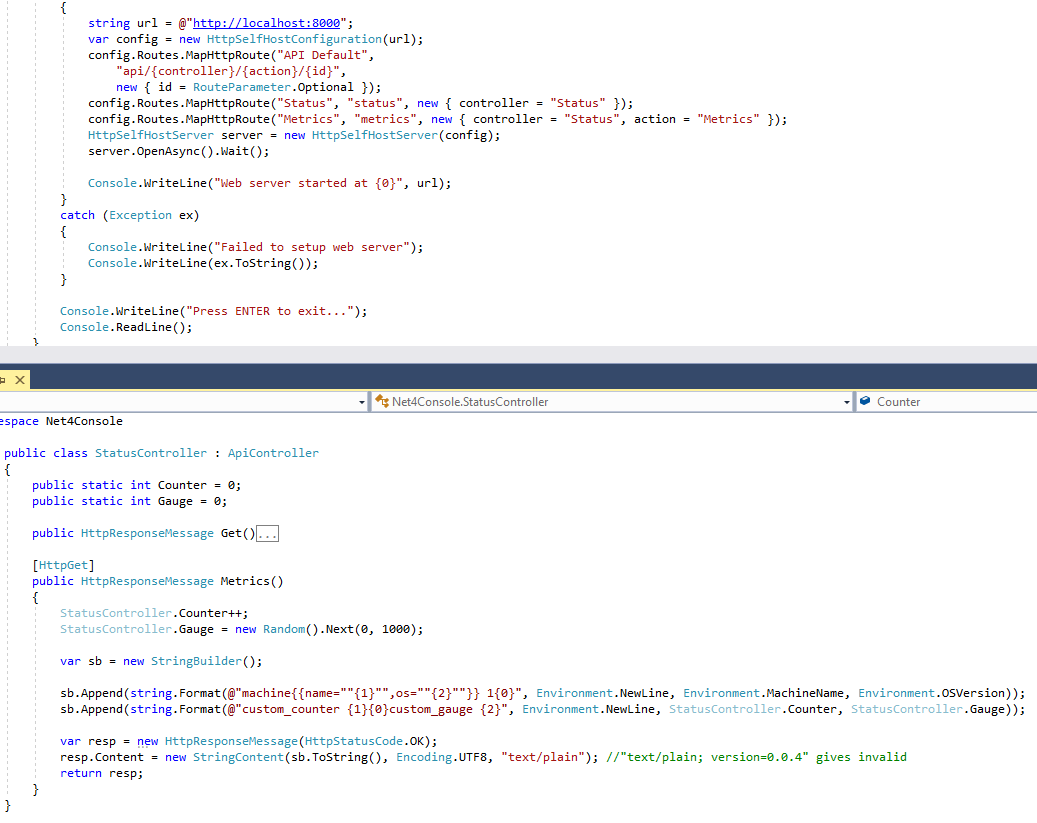
Dont forget to allow the required port in Windows firewall; as later Prometheus will be accessing this http endpoint from a remote machine (from Docker Host/VM)
For the Prometheus; we need to expose our application�s metrics data in the text/plain content type. The format is available at https://github.com/prometheus/docs/blob/master/content/docs/instrumenting/exposition_formats.md; I am just exposing three test metrics. Once we have it running; we can setup Prometheus components and Docker Containers are great way to try out new thing and there exists official images for Prometheus components. I am going to use the following Docker Compose file and using Docker for Windows (or Linux in some VM etc) can bring all these components online with just docker-compose up. For details read docker-compose.html
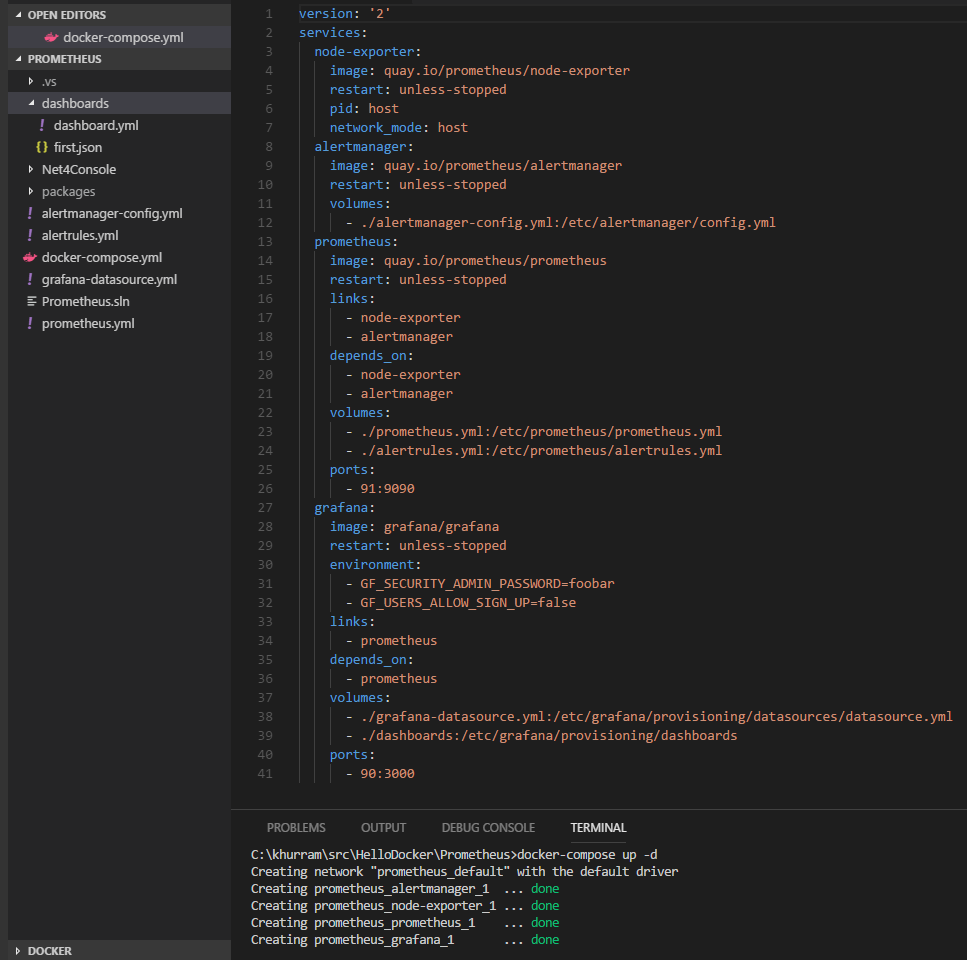
In my setup; I have a Node exporter that will expose the Docker VM/Host metrics, an Alertmanager, Prometheus Server and Grafana. All the configuration files for Prometheus components are YML files similar to docker-compose and are included in the repository. These files along with the .NET 4 Console project is available at https://github.com/khurram-aziz/HelloDocker under Prometheus folder
- Note that Node exporter container is run with host networking and host process namespace so that it can get the metrics of the host and bind its http endpoint on the host ip address.
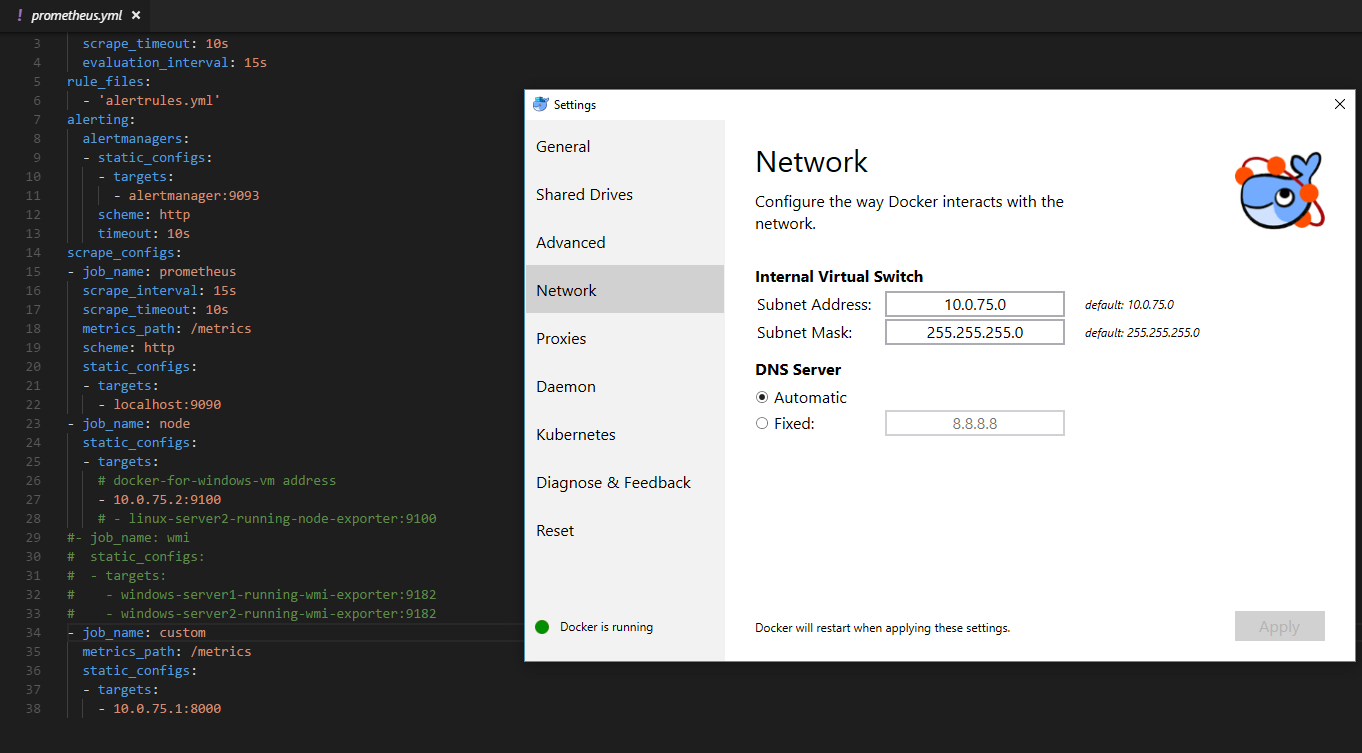
- Prometheus is configured according to my Docker for Windows Networking setting, if its different for you; or you are using Linux host to run the Docker; change it accordingly. You will need to change target addresses of Node exporter and Custom jobs in prometheus.yml
The Alertmanager is being configured through its config file in a way that if some service that it is polling gets down for two minutes or the Node exporter reports that CPU is 10% or more for two minutes; it will send an alert on Slack. You need to specify the Web hook URL in the config file. Yon can change or add more rules as per your requirements. If you are not using Slack; and want the good old Email alerts; there are documentation and tutorials available online
- Important thing to note is; you can have Alertmanager setup to send alerts to some database as well; in case you want to log �incidents� for SLA or something
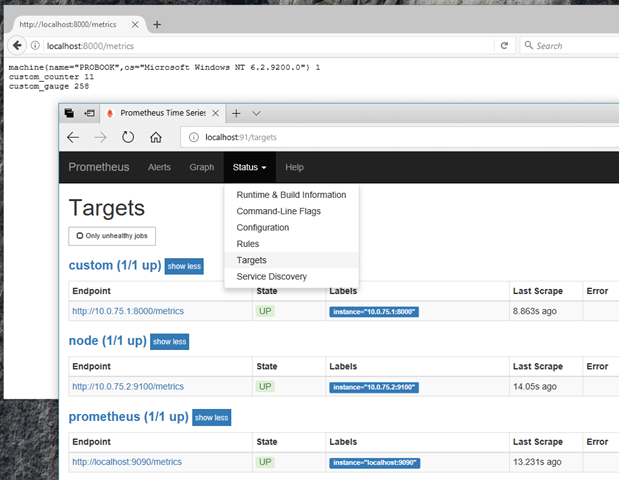
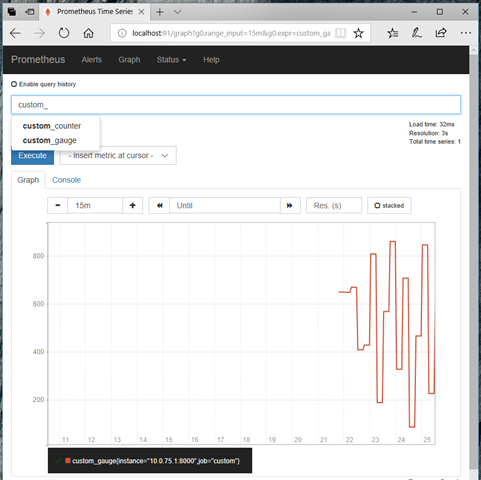
If we have all the things setup properly and running; we can check our custom app metrics url and explore Prometheus through its Web interface
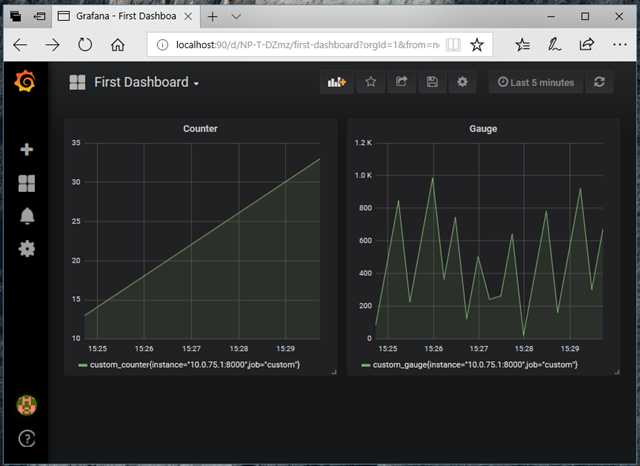
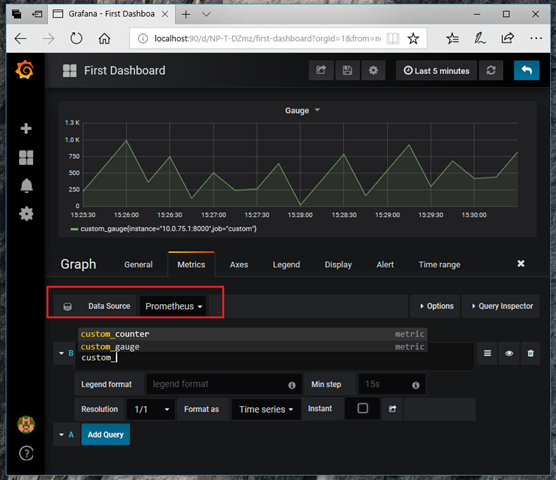
The Grafana will also be up with �First Dashboard� showing our metrics in the time graph; feel free to play with the dashboard and see that Grafana has the rich Prometheus support, along with its query auto completion etc
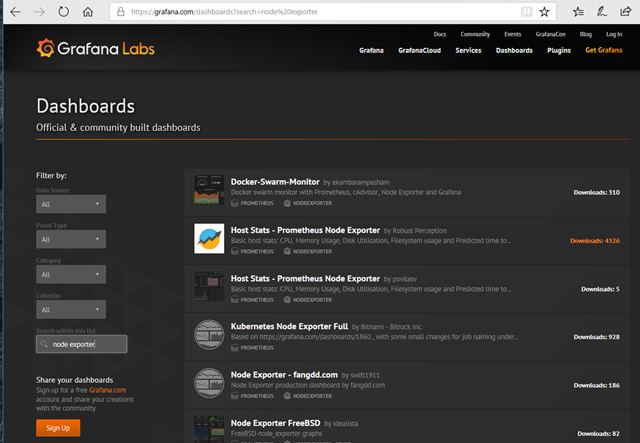
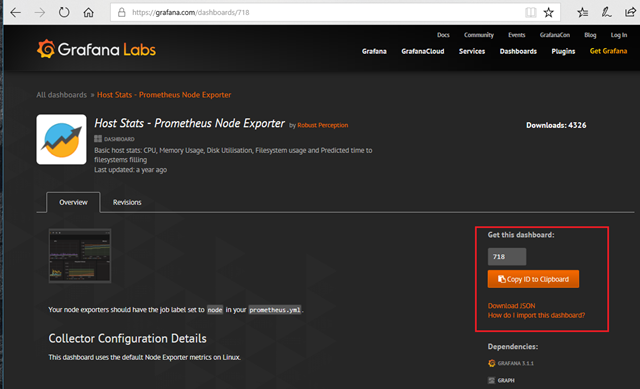
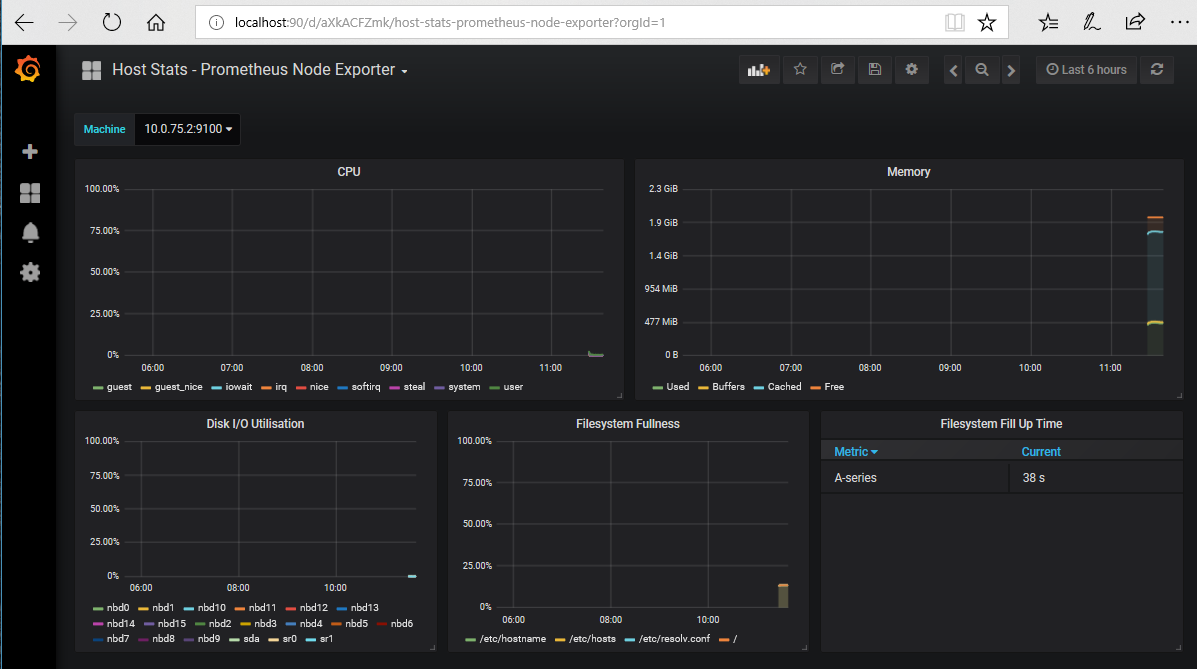
Grafana dashboards can be imported and exported as JSON files and there are many official and community built dashboards available that we can easily import and start using. For our Node exporter; we can easily find some nice already made dashboard there. We just need the dashboard ID (or its JSON) file and we can easily import it into our Grafana setup
For importing from Grafana.com; we just need the ID of the dashboard; and update/configure the data source
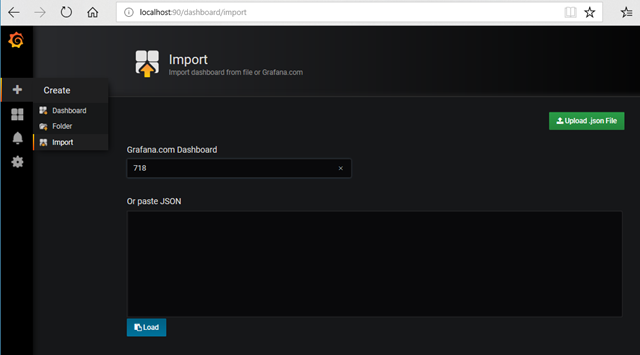
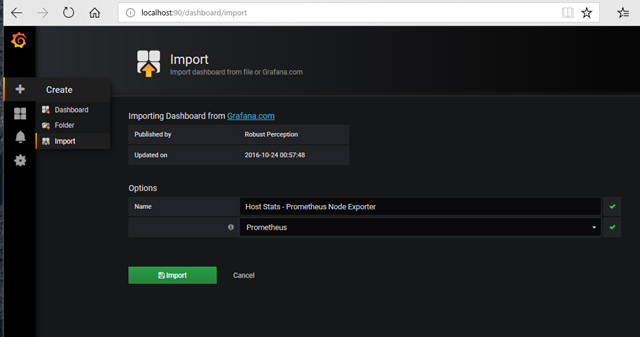
With few clicks; we will have a beautiful looking dashboard showing the Node exporter metrics
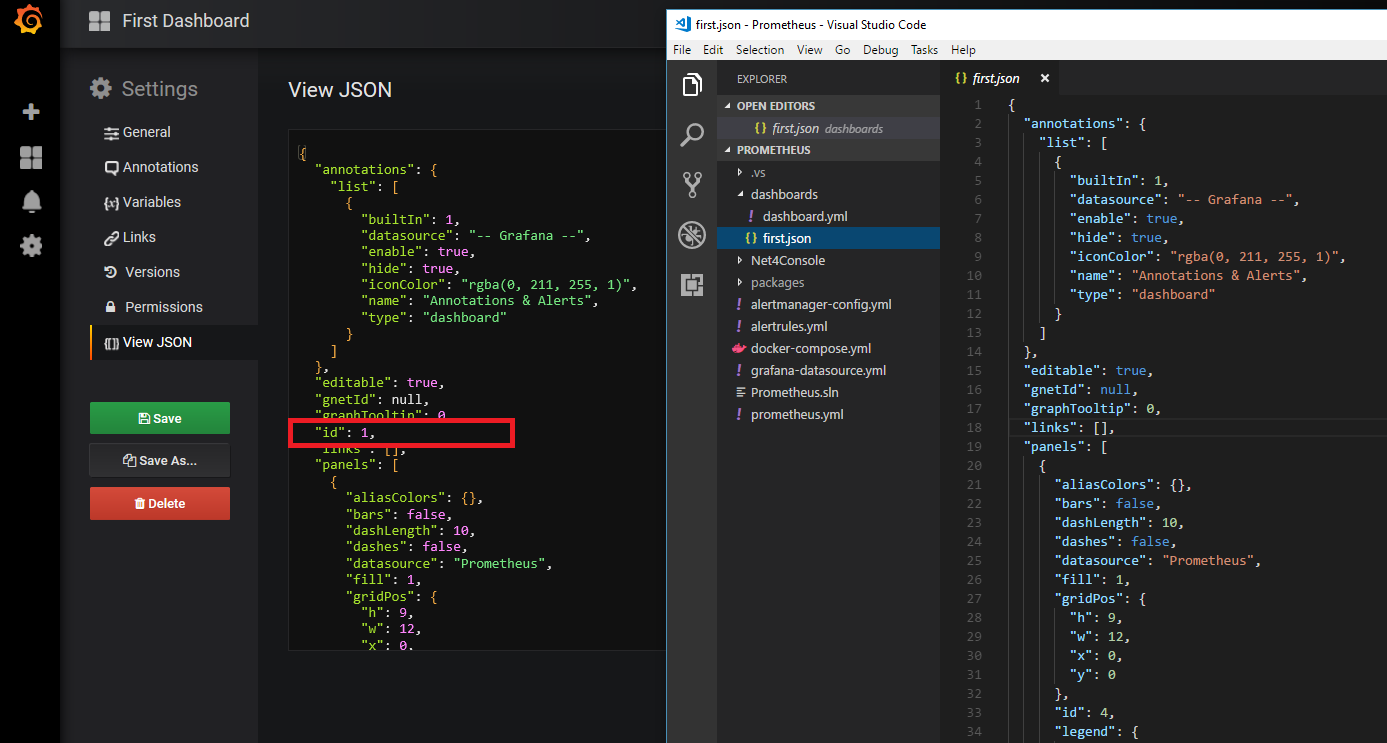
We know that Containers are immutable; and our customizations will be lost; unless we are mounting some volume and keeping the data there; or after edit/tweak the dashboard; or creating a new dashboard for our custom metrics; from Dashboard Settings we can export the JSON file. This JSON file then can be imported into our Docker Container when it is built and these dashboards will get provisioned automatically. The Grafana Container in our setup is configured accordingly; you can check Grafana YML and dashboards folder. Simply create a dashboard as per your liking and demand and then export the JSON file and remove its �id� and place the JSON file into the dashboards folder. This Grafana Provisioning feature was introduced in v5
In the repository I have just included one dashboard for our custom metrics; as an exercise try importing some dashboard from Grafana.com first, export its JSON file, place it in dashboards folder and rebuild the container!
Happy Monitoring!
Repository: https://github.com/khurram-aziz/HelloDocker
