TICK Series
- InfluxDB
- This Post
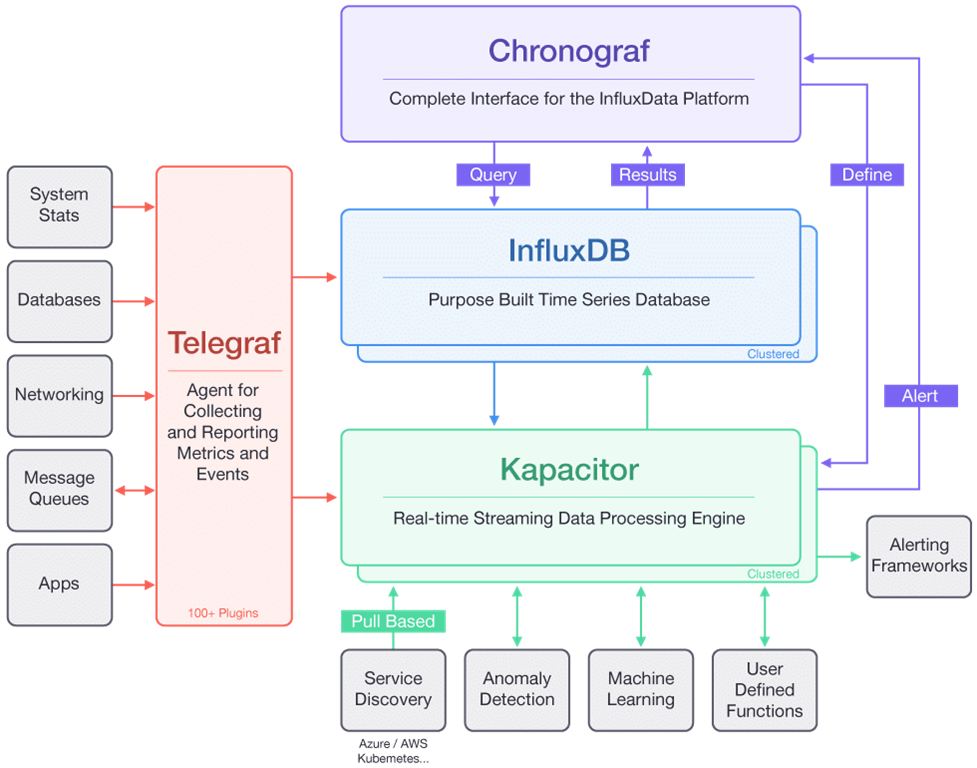
Telegraf is the daemon written in Go for collecting, processing, aggregating and writing metrics. It has plugins through which it offers integrations to variety of metric sources. It can pull the metrics from third-party APIs as well and can even listen for metrics via StatsD and Kafka consumer services. It then inserts the collected metrics to InfluxDB and can even push collected metrics data into Graphite, Kafka, MQTT and many others through its output plugins. It also has processor plugins through which we can transform, decorate and filter the collected metrics and we can also aggregate these collected metrics using the aggregator plugins. There are over hundred of these four types of plugins and one can write ones own; these plugins make Telegraf very extendable.
Visit https://github.com/influxdata/telegraf for the complete list of plugins. For this post; I am going to use SNMP plugin. We will be polling Temperature and Network Interface Traffic from Mikrotik Routerboards. Simple Network Management Protocol (SNMP) is an Internet Standard protocol for collecting and organizing information about managed devices on IP networks and for modifying that information to change device behavior. SNMP uses an extensible design which allows applications to define their own hierarchies. These hierarchies, are described as a management information base (MIB). MIBs describe the structure of the management data of a device subsystem; they use a hierarchical namespace containing object identifiers (OID). Each OID identifies a variable that can be read or set via SNMP. We will not be using MIBs; we can use official Telegraf Docker Image as is; otherwise one need to install SNMP-MIBs in the container. The Telegraf SNMP plugin supports both the SNMP-GET and SNMP-WALK. We can retrieve one or more values using SNMP-GET and can use these retrieved values as tags with GET (Field) or WALK (Table) metrices. We will be retrieving the device host name and use it as a tag with temperature as well as interface metrices
Mikrotik Routerboard OS has two temperature OIDs; one for the sensor in its chassis and the other for its CPU temperature. The bandwidth interface information can be retreived by walking the well known OIDs for interface names, their bytes in and out counters. These SNMP configurations are made in the telegraf.conf file�s [[input.snmp]] sections. In the configuration files� [output] section we specify where we want to push the retrieved metrices. Lets create a telegraf.conf file and add Telegraf service into our Docker Compose file we created in InfluxDB post
- All required files are available in Tick folder @ https://github.com/khurram-aziz/HelloDocker
- If you are new to Docker / Docker-Compose; visit docker-compose.html


- We are retrieving values from multiple SNMP agents each 60seconds
- The measurement will be named �rb� for the fields and rb-interfaces for the table
- �rb� measurement will have two temperature values
- �rb-interfaces� will have the in/out counter values; the retrieved interface name will be used as tag
- The hostname of the device will be used as tag in both measurements
Running docker-compose up; we can bring our setup online and after a while; we should be able to see the measurements that Telegraf is pushing to InfluxDB�s telegraf database in the Chronograf. If you are not following �TICK series� posts and has landed on this post directly; please refer to InfluxDB post for details on InfluxDB and Chronograf

- Notice that Telegraf has also added agent-host label with the IP value of the SNMP Agent
- The values need to divide by 10 to get the temperature in Celsius; Router OS is doing this so it can give out the fraction part using INTEGER data type through SNMP
In the Docker Compose; we exposed/mapped the InfluxDB HTTP port; we can run the InfluxDB queries from the host directly using CURL etc to debug/see what�s going on

Interestingly; Telegraf has a Prometheus Client Service Output plugin with which we can use it with Prometheus. Prometheus is based on pull model; this plugin starts the HTTP listener where it publishes the retrieved metrices and from where Prometheus can pull. To set it up; lets configure the plugin in telegraf.conf�s output section, bring in Prometheus configuring it to poll from the plugin endpoint. When we will bring things online; Telegraf will start pushing the metrics to InfluxDB as well as make them available at the Prometheus Client endpoint from where Prometheus will start polling accordingly

Once the data is in Prometheus; we can even bring Grafana and can start making Grafana dashboards.
- Refer to Prometheus blog post for more information


I like Telegraf with its SNMP plugin more than Prometheus� SNMP-Exporter and having Telegraf in the environment opens up and enables more possibilities. Grafana also supports InfluxDB and we can have the dashboards using both Prometheus and InfluxDB as Time series data sources. While graphing Bandwidth COUNTERs from SNMP in Grafana, you will need to use Prometheus� rate() function and InfluxDB�s derivative() function.
- The rate() function calculates the per second average rate of increase of the time series in the range vector given as parameter; below it will give the average rate of increase in 5min. The counter resets are automatically get adjusted
- The derivative() function returns the rate of change between the subsequent field values and converts the results into the rate of change per unit; given as second parameter; below given we need /sec rate of the bandwidth we are giving 1s as the second parameter
The InfluxDB derivative() function seems more close to how classic RRD/MRTG graph the bandwidth counters


- Note that Grafana offers a rich InfluxDB query editor; and if you want to can switch to text mode where you can write InfluxDB queries directly
- Note that writing InfluxDB queries can become cumbersome for system administrators; they will like Prometheus more while developers might find InfluxDB more powerful and feel comfortable due to its RDBMS like queries
If you want to; you can remove Chronograf and even InfluxDB, and can use Telegraf directly with Prometheus / Grafana setup, or you can use Grafana with InfluxDB and not use Chronograf for dashboards. Its totally your preference!
- Docker compose, container configuration and all other required files are available in Tick folder @ https://github.com/khurram-aziz/HelloDocker