Time Series Databases
| Elasticsearch Series
|
If you ever managed a Linux server or developed application for it; you probably know about Splunk; it captures, indexes and correlates real-time data in a searchable repository from which it can generate graphs, reports, alerts, dashboards and visualizations. There exists free version that one can try out or even use in production, it comes with 500Mb / day indexing limit, which is enough for many applications. Splunk also has API and allows third party applications, there is even official C# SDK in case its your preferred development platform; seeing the Github activity of its repository seems like nothing much going on there lately. There exists an open source and much better alternative; Elasticsearch. Its open source, actively developed and maintained, strong community and ecosystem and offers not one but two .NET client libraries NEST and Elasticsearch.NET and they are actively maintained and developed.

Out of box scalability due to built sharding (the index can be divided into shards and each shard can have zero or more replicas across multiple Elasticsearch nodes), snapshot and restore features, storing data as JSON and exposing it RESTfully, indexing and search capability of Elasticsearch makes it fantastic option for structured and unstructured data including free text, system logs and more. It can be used to search
Elasticsearch is highly API driven and provides strong support for storing time series data and Kibana offers Time Filters and together they can be used as Time Series database and visualization tools. Given Elasticsearch has strong support of structured and unstructured data, we can store much information in the time series along some metrics values.
For this post; I am going to use ELK as Splunk alternative. Splunk offers a SYSLOG server where we can push system logs. Linux logs a large amount of events to the disk, where they’re mostly stored in the /var/log directory in plain text. Most log entries go through the system logging daemon, syslogd, and are written to the system log. The logger utility allows you to quickly write a message to your system log with a single, simple command.

SYSLOG is a standard for message logging. It allows separation of the software that generates messages, the system that stores them, and the software that reports and analyzes them. Each message is labeled with a facility code, indicating the software type generating the message, and assigned a severity level. We may use syslog for system management and security auditing as well as general informational, analysis, and debugging messages. A wide variety of devices, such as printers, routers, and message receivers across many platforms use the syslog standard. Implementations of syslog exist for many operating systems. Many Unix and Unix like OS including Ubuntu comes with a service called rsyslogd that can forward the system log messages to IP network including SYSLOG server. On Ubuntu its configuration file is located at /etc/rsyslog.d/50-default.conf

We can add an entry *.* @Your-Syslog-Server:514 entry there to send all log entries to some SYSLOG server. Watson Syslog Server is descent and simple C# code that we can modify to push syslog messages to Elasticsearch using NEST or Elasticsearch.NET client libraries (or push the syslog data to some other database of your choice)
- With *.* we are sending all log files; we can filter here which logs we are interested; for instance we can use cron.* to send just cron logs
- 514 is the UDP port of your syslog; if your syslog server is listening on some other port; change it accordingly
 iptables is a user-space utility program that allows a system administrator to configure the tables provided by the Linux kernel firewall (implemented as different Netfilter modules) and the chains and rules it stores. Different kernel modules and programs are currently used for different protocols; iptables applies to IPv4, ip6tables to IPv6, arptables to ARP, and ebtables to Ethernet frames. UFW, or Uncomplicated Firewall, is an interface to iptables that is geared towards simplifying the process of configuring a firewall. While iptables is a solid and flexible tool, it can be difficult for beginners to learn how to use it to properly configure a firewall.
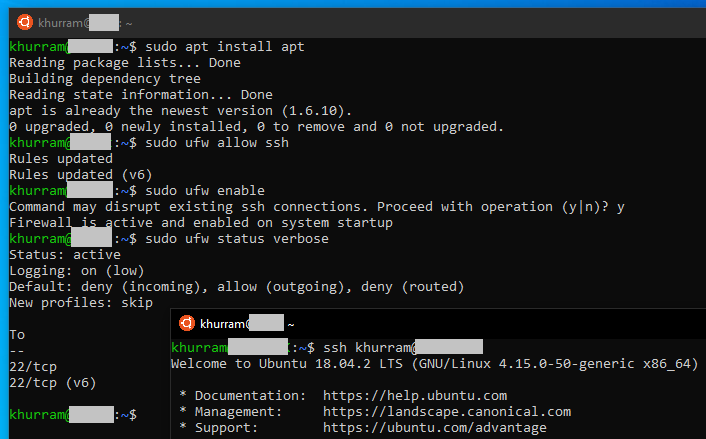
On Ubuntu, we can install ufw using apt, dont forget to allow SSH before enabling it and check you can sush your system after enabling it to avoid getting yourself locked out. The nice thing UFW does is that it also add log rules, so when it blocks something they also gets logged into the system log that we are forwarding to a SYSLOG server. So we now have a setup that blocked traffic will get reported at our syslog server

Logstash is an open source, server-side data processing pipeline that can ingest data from different sources, transforms it, and then sends it to “stash”; Elasticsearch is preferred choice naturally. It supports a variety of inputs that pull in events or can listen where events are submitted, can ingest from logs, metrics, web applications and other data stores, all in continuous, streaming fashion. It can then filters parse each event, identify named fields to build structure, and transform them to converge on a common format for more powerful analysis and business value. It then route data where we want, giving us the flexibility and choice.
- Logstash Input Plugins; they enable a specific source of events to be read by Logstash
- Filter Plugins; they perform intermediary processing on an event. Filters are often applied conditionally depending on the characteristics of the event
- Output Plugins; they send event data to a particular destination. Outputs are the final stage in the event pipeline.
There can be multiple pipelines in given Logstash instance; one simple Hello World pipeline looks like this:
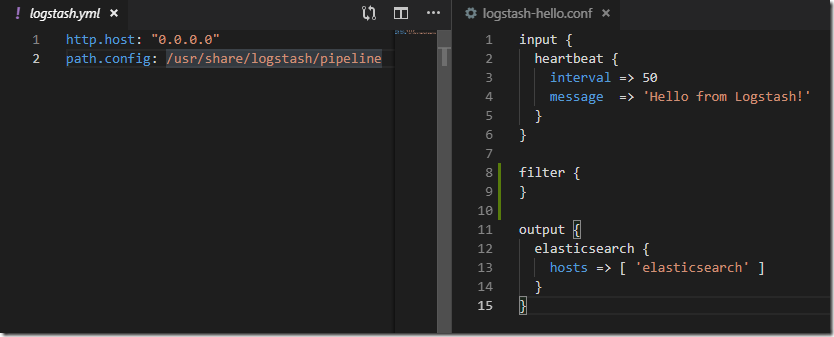
- heartbeat input plugin generating test even, Hello from Logstash! message each 50sec
- There is no filter
- elasticsearch output filter writing the event to Elasticsearch
There is a Syslog input plugin using which we can make Logstash acting as Syslog server receiving logs/events and a Grok filter plugin that can parse unstructured log data into something structured and queryable. It is perfect for syslog and other such logs type events. Logstash comes with 120 parsing patterns that we can use and can add our own as well.
With a Logstash pipeline like below; we can listen to Linux system logs at 5000 udp as syslog server. We can then use grok plugin in the filter section and parse the syslog message.
In the example above; if grok pattern succeeds the rich fields will get created defined in the pattern. We can detect this using _grokparsefailure tag that grok plugin will add. If its parsing; we are applying mutate filter plugin to remove message field that gets created in the first step. We can further parse the UFW syslog message and extract the source IP and apply geoip filter that will add Geolocation fields.
In output, if event source was syslog input plugin and we were able to parse the message; we are writing to syslog-* index at Elasticsearch otherwise writing to logstash-* index. UFW parsed messages are logged into logstash-* index
- All documents in Elasticsearch are stored in some index
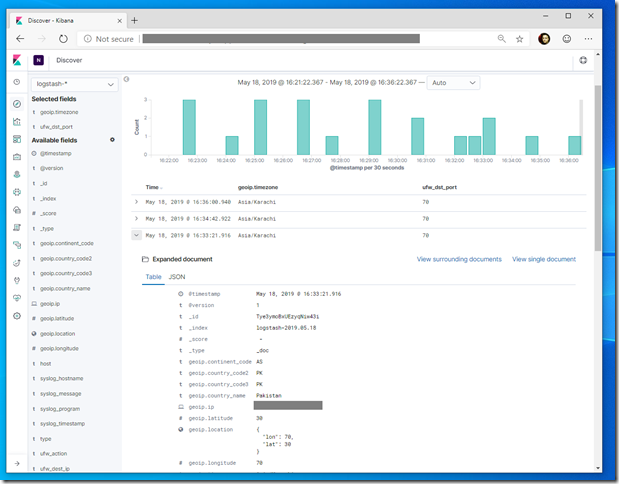
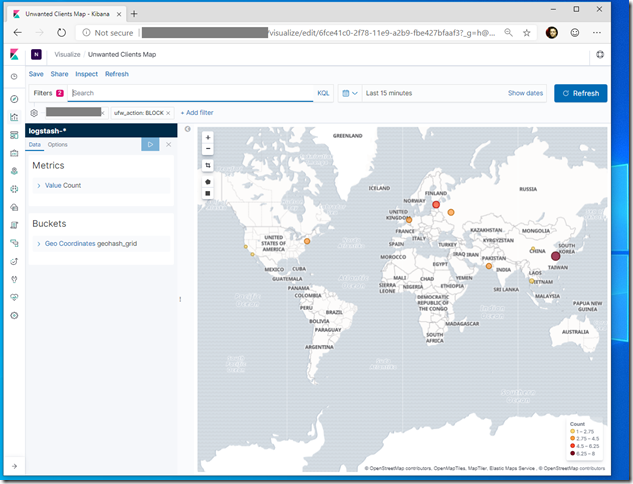
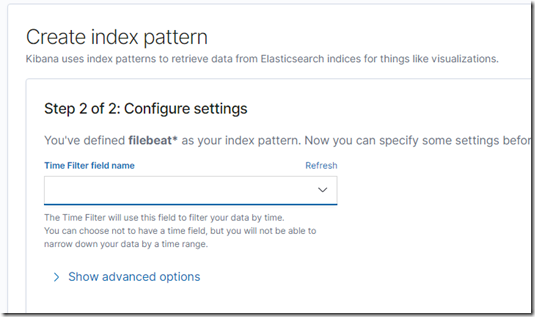
Kibana lets you visualize your Elasticsearch data and navigate the Elastic Stack. We can query/filter and view Elasticsearch data in tabular and graphical forms. We first define Kibana index; for instance logstash-* and optionally specify the time field to apply time filters on our time series data. If everything is in order we can quickly find out in Kibana from where traffic is being blocked (if any)
- All required files are available in Elk folder @ https://github.com/khurram-aziz/HelloDocker
