Prometheus Series
- Prometheus
- Swarm and Prometheus
- This Post
Time Series Databases
Docker Swarm Series
In the last post; we had our application running and being monitored in the Swarm cluster; but we have few issues and in this post we will try to solve them.
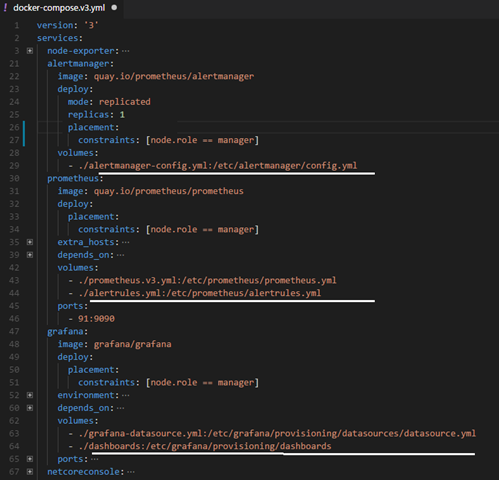
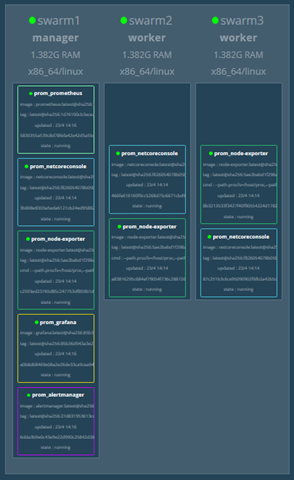 The first issue is that our containers are not deployed in balanced way; most of our containers are made to run on the Manager Node because these containers need the “configuration files” that we are providing to them using the “volumes” binding. We can remove the placement constraint from our stack deploy compose file; but these containers will not work as the files were not be found on the “worker nodes”. This can be fixed by either using absolute path as source of these configuration files and copying all these files to that particular path on each node (manually or using some script/Git trigger) or we can place these files at some network location that is mounted to the specified location as source on each node. The second way is that we make our own docker images that already has these configuration files; we will have to write Dockerfiles; build them and push them to the registry; similar to our application container; so each Swarm node can get the image when/where required
Docker 17.06 onwards we have something called “Docker Configs”; using which we can these configuration files “outside” the container image; we create these configs using the Docker CLI or Compose files; and these config files gets uploaded to Swarm Manager that encode it and keep it in its “store” and provides an HTTP API using which Swarm Nodes can “download / retrieve” these configs (or config files). The Compose file has the support of these configs and we can remove the volume entries and replace them with config entries.
The second issue is; all the containers that we need to expose so we can access them; like Prometheus and Grafana needs to be at some known location so we can access them using the known node IP/DNS name. This restriction will continue to give Manager heavy Swarm cluster; something that we dont want; instead we want to keep Manager lightweight; and use Workers to do heavy lifting.
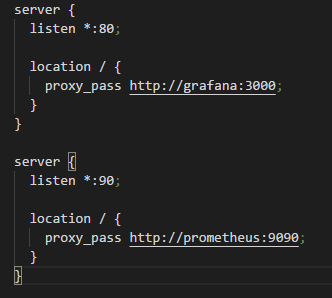
Given our containers are exposing HTTP services; we can setup a Reverse Proxy on a known location; usually Manager node
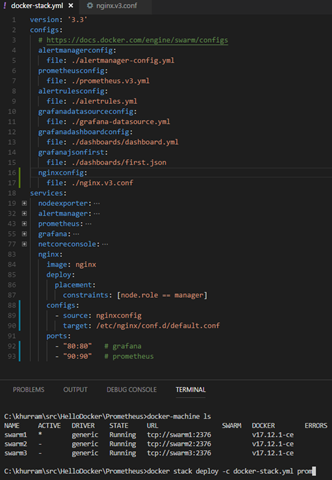
Lets rewrite the Stack Deploy compose file replacing volume with the config entries and adding NGINX a popular reverse proxy. We will have to write another config file for Nginx that we can pass using the Docker Configs. The other benefit by using Docker Config we will get is that we no longer have to copy YML and config files to Swarm Manager; using docker-machine and pointing our environment to appropriate Swarm Manager node; we can deploy our stack from a remote machine (development box or some CI/CD system)
- Docker Configs can be string or binary data upto 500kb in size; for larger files its better that we create our custom image having the required configuration or content; say you have lot of files in Grafana dashboards; its better to create custom image and push to the registry and use its image path
- Docker Configs are not kept or transmitted in encrypted format; there is similar feature called Docker Secrets that should be used for keeping sensitive configuration for things like database connection strings or Grafana admin password in our project
References
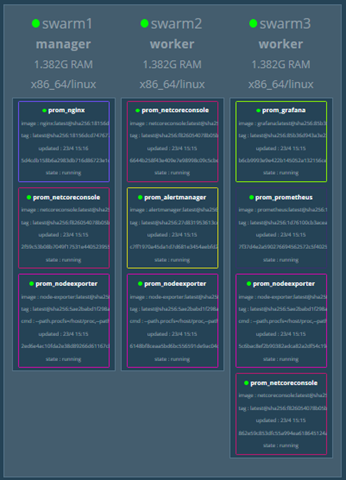
Our docker-stack compose file will look like this; and we will end up with a balanced Swarm
- All the code and required files are available in Prometheus folder at https://github.com/khurram-aziz/HelloDocker
For the Nginx reverse proxying we dont need anything special given Swarm does the DNS based service lookup; our service containers can be anywhere and Reverse Proxy will be able to discover and Proxy them straight away
The third issue is; that we are monitoring the nodes; but not the Docker Engine running on it; how many containers are running etc. The Docker Daemon exposes rich information and there exists many solutions online; I linked one in the last post. There is also Google’s cAdvisor that’s very popular in Kubernetes community. cAdvisor exposes itself as web interface and exposes Prometheus metrics out of the box @ /metrics
- https://www.ctl.io/developers/blog/post/monitoring-docker-services-with-prometheus is the officially linked resource
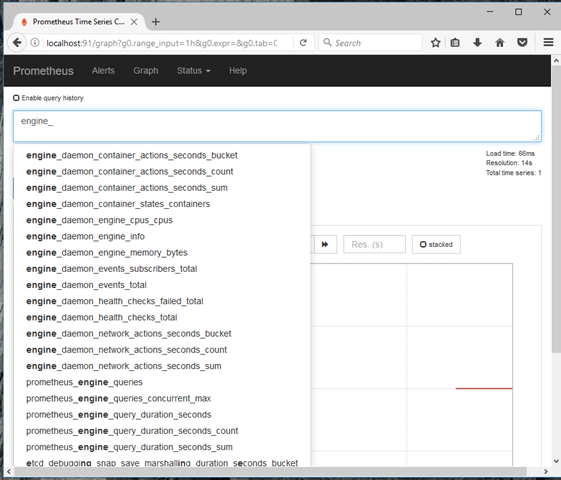
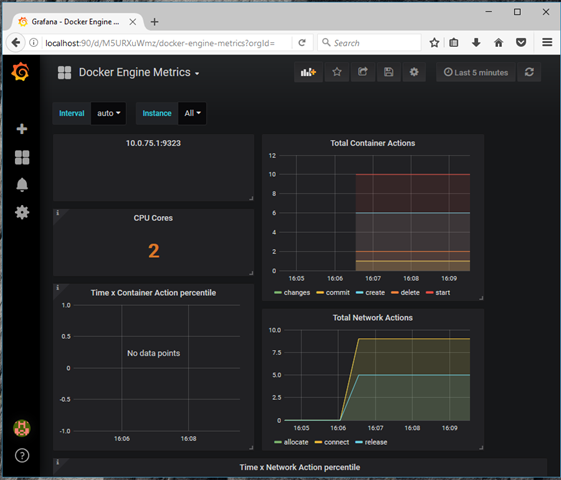
Given Prometheus is adopted and now officially a Cloud Native Computing Foundation (CNCF) project; Docker Daemon since v1.13 now exposes its metrics for Prometheus. However its wrapped under the experimental flag and sadly my Swarm setup doesnt allow setting required flags for the Docker Daemon. You can try it out with the standard Docker Daemon by setting the experimental flag and setting Metrics endpoint as metrics-addr
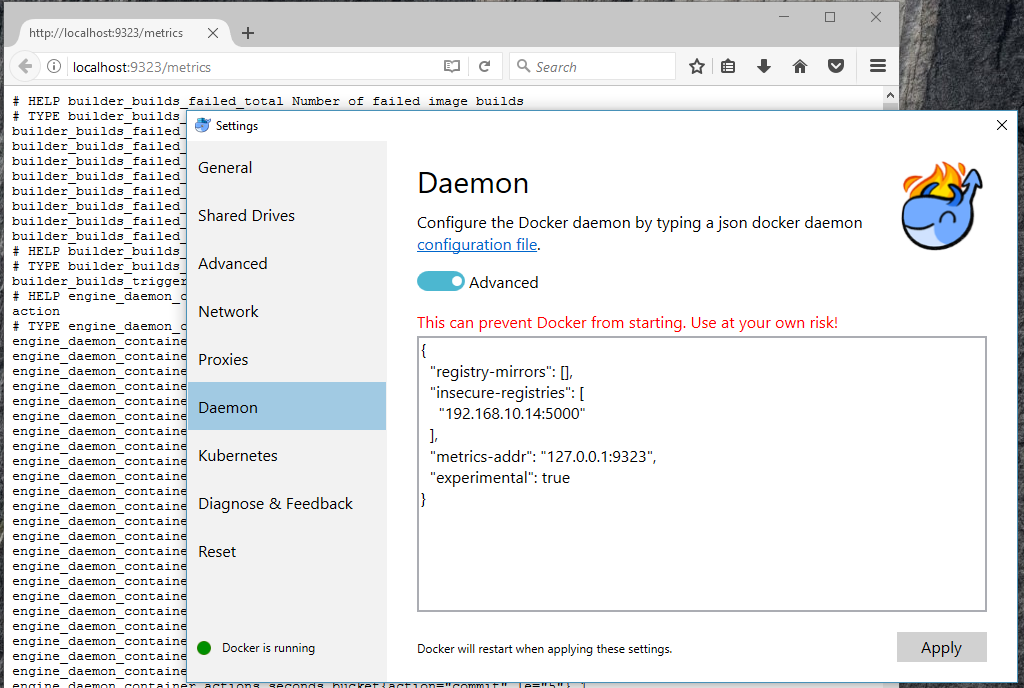
- https://docs.docker.com/config/thirdparty/prometheus for more details
You can then give the address of the machine running the Docker Daemon and setup the Prometheus job accordingly. The Grafana dashboard for Docker Daemon are also available that you can use and customize
- All the code and required files are available in Prometheus folder at https://github.com/khurram-aziz/HelloDocker
