| Prometheus Series
| Time Series Databases | Docker Swarm Series |
To monitor the Docker Swarm and our application running in the cluster with Prometheus; we can craft a v3 Compose File. To continue from the previous post; for the Swarm; we will like to have our Node Exporter running on all nodes. Unfortunately the host networking and host process namespace is not supported when we do docker stack deploy onto the swarm. Node Exporter and the Docker image we are using supports the command line argument and we can tell it that required directories are someplace else and using Docker Volume support can map the host directories to the container and pass the mapped paths to Node Exporter accordingly
- All the code and required files are available in Prometheus folder at https://github.com/khurram-aziz/HelloDocker

- We will have to expose the Node Exporter port
- Note that we are deploying the container globally so each participating node get its own container instance; we will end up having the Node metrics at http://swarm-node:9100 url of participating nodes
If we have three nodes and we want to have a friendly host names for them to use in prometheus.yml Job definition; we can use extra_hosts section in our compose file. Further; if we want to access Prometheus we need that its container gets scheduled at some known node; so we have http://some-known-name:port url to reach Prometheus. We can do this using the constraints section in the Prometheus service section of the compose file

In the previous Prometheus post; we made a .NET 4 console app and ran it on the development box. For the Docker Swarm; we need something that can run in the cluster. We can code .NET Core Console and use prometheus-net client library to expose the metrices. Our app will be deployed in the cluster so it will have multiple instances running; each container instance will get its own IP address and Prometheus label the metric with this information; but its a good idea that we also include our own labels to identify which metric is coming from where.
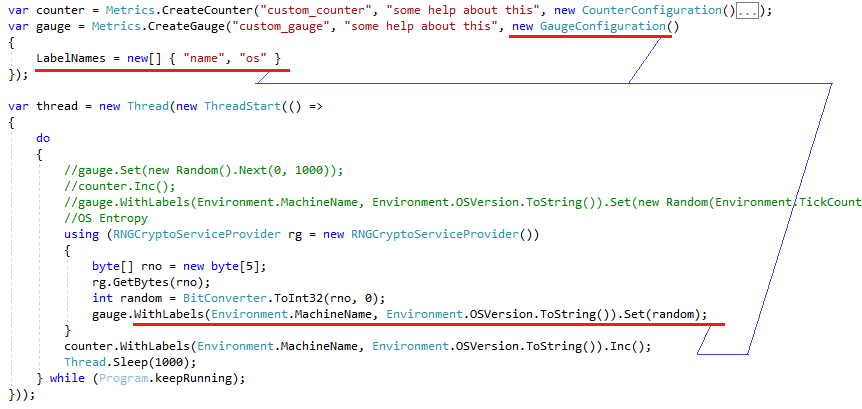
 I am using machine, custom_gauge and custom_counter matrices from the previous post; however for the Swarm; have added name and os labels using the prometheus-net client library. These labels will be given Machine Name and its OS Version values
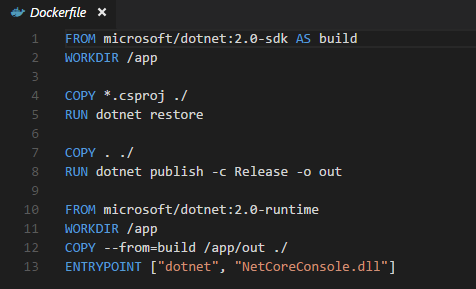
One important thing to deploy the custom Docker image on the Swarm is that it needs to be “available” or “accessible” on all Swarm Nodes; this can be easily done by having a Docker Registry. Docker now has Multi Stage Build option and we can avoid to give access to Docker Registry to development box where we are building the Docker image or having Jenkins (or similar build environment). The Swarm node can compile and build .NET application on its own using this Multi Stage Build thing; there exist seperate SDK and RUNTIME official docker images
- For this to work; we need to upload all the required files to the Swarm node where we will initiate this multi-stage build thing. We can either SCP or use GIT (or something like it) for this
- You can still go the traditional way by building the image on the development box and pushing from there to your docker registry; or tar-zip it from the development box and import in each node individually; whichever way you choose; all the Swarm Nodes need to either have or know a way to access the required image to run
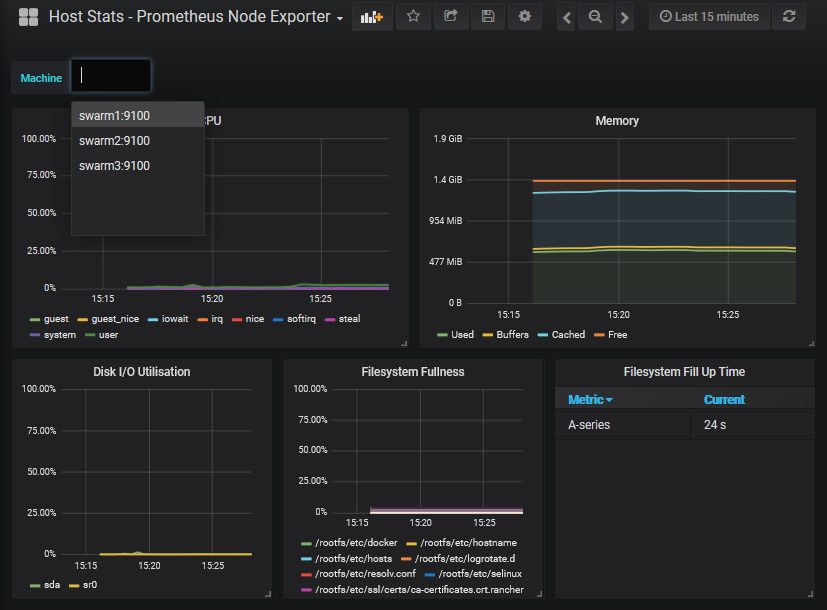
Now if we bring our stack up using docker stack deploy and deploy the Host Stats dashboard (see the previous Prometheus post); we can view and monitor the Node Exporter matrices of each Swarm Node
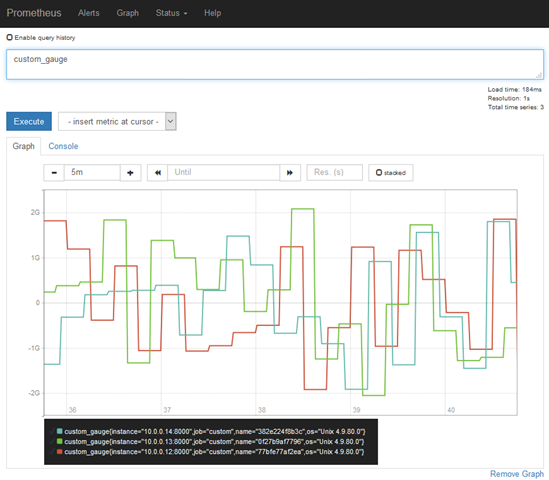
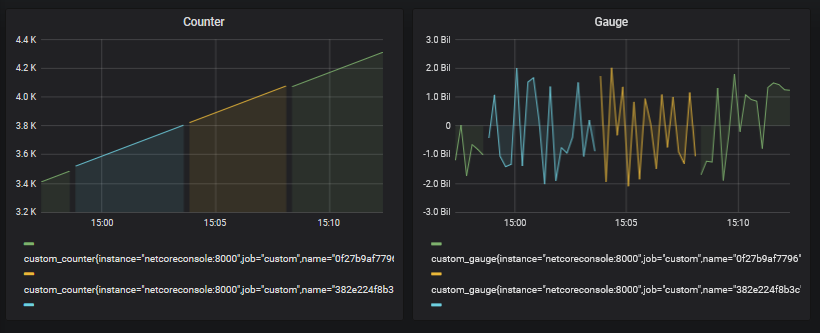
However our custom application’s dashboard is not how we want; our application is deployed and running on all nodes (that we can verify either from Docker CLI or using Visualizer; see first Docker Swarm post) but Prometheus is not retrieving matrices from all these nodes simultaneously instead it is getting it from one node first and then from second and so on. This is happening because we had “netcoreconsole:8000” as target entry in the job and Docker Swarm is doing DNS round robin load balancing. Note that the instance label that Prometheus is adding is same but our custom label name is different for three nodes
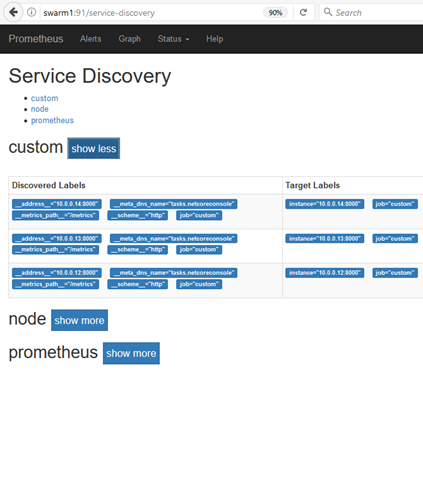
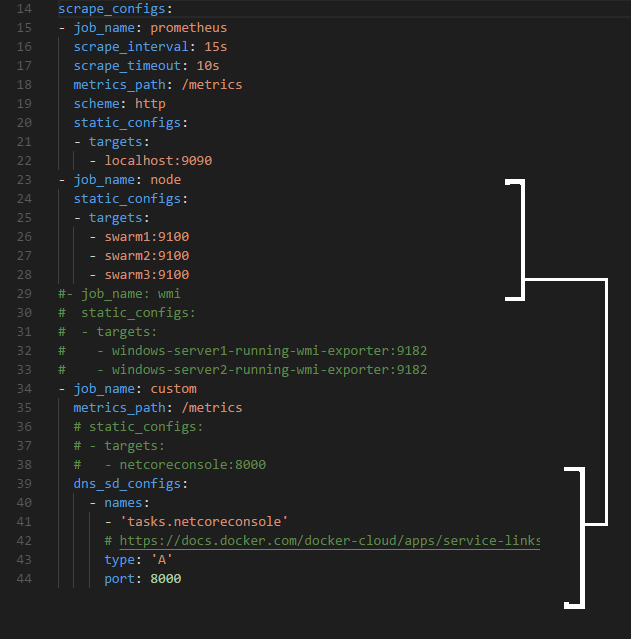
Prometheus has Service Discovery options; we can use Docker Swarm service discovery support; the Swarm exposes a special tasks.service dns entry and it will have IP addresses of all the associated containers of the service. Instead of using static_configs entry we can use dns_sd_configs entry with this special DNS entry and Prometheus will discover all the nodes and start retrieving the matrices
- For more Prometheus Service Discovery information see https://prometheus.io/blog/2015/06/01/advanced-service-discovery
- As an exercise; try to use DNS Service Discovery option with the Node Exporter Job as well
We can confirm that it has discovered all the containers from the Service Discovery interface; and graphing our metrics we should see values coming from all the participating nodes in parallel now
This should automatically get reflected in Grafana as well
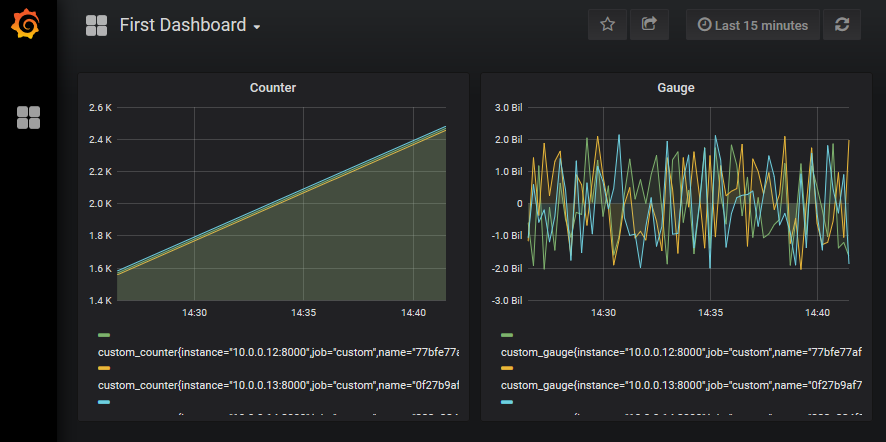
We now dont need to expose the Prometheus; we can deploy it on the Swarm anywhere; the Grafana will discover it in the Swarm using the Service DNS entry that Swarm makes available. We only need Grafana to be running at the known location in the Swarm
- All the code and required files are available in Prometheus folder at https://github.com/khurram-aziz/HelloDocker
I remained focus to our custom application and its monitoring when running in Swarm. If you want to monitor your Swarm; take a look at https://stefanprodan.com/2017/docker-swarm-instrumentation-with-prometheus; an excellent work done by Prodan; and he has made all that work available on Github as well
